6.1.4 Basic 3D Plotting3D-Plotting-Basic
Summary
In Origin, Contour plots and 3D plots, such as Color Map Surface plots, can be created directly from XYZ data.
But, if you want to plot a smoother 3D surface, you are strongly advised to use one of Origin's built-in gridding routines to convert the XYZ data into a matrix.
Minimum Origin Version Required: Origin 9.0 SR1
What you will learn
This tutorial will show you how to:
- Create a 3D graph from XYZ data
- Use the Layer Contents dialog to add/remove a data plot
- Convert XYZ data into a Matrix
- Use the Plot Details dialog to customize a graph
Create a 3D Surface and Scatter Plot
- Select Data: Connect to File: Text/CSV to import the file \Samples\Matrix Conversion and Gridding\XYZ Random Gaussian.dat with default settings.
- Highlight column C and click Z button
 from the mini toolbar that appears. from the mini toolbar that appears.
- Select Plot > 3D : 3D ColorMap Surface to create a 3D Colormap Surface plot (Graph1 by default).

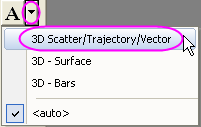
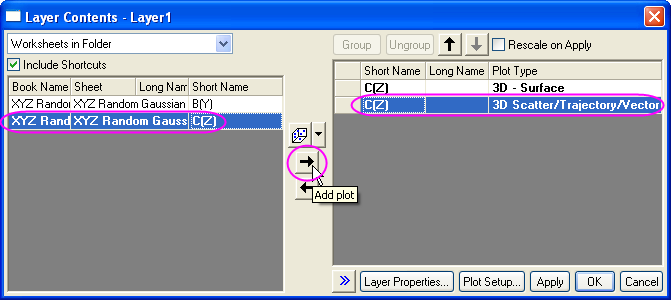
- Right click the layer icon on the left-top of the graph to open the Layer Contents dialog. In this dialog, click on the
 button and select 3D Scatter/Trajectory/Vector from the fly-out menu. button and select 3D Scatter/Trajectory/Vector from the fly-out menu.
- Select column C from the left panel and click on the Add Plot
 button to add the 3D scatter plot to the graph. Click OK to close the dialog. button to add the 3D scatter plot to the graph. Click OK to close the dialog.
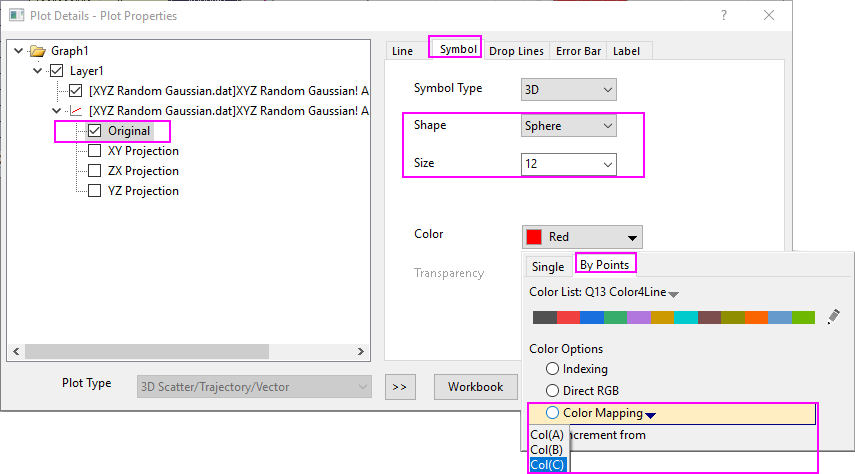
- Double-click on the scatter plot of Graph1 to open the Plot Details dialog. In the Symbol tab, set Shape to Ball, Size to 12 and Color to Map: Col(C)(expand Color Chooser to do settings in the By Points sub-tab as shown below).
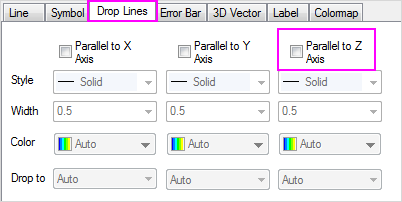
- In the Drop Lines tab, uncheck the Parallel to Z Axis checkbox.
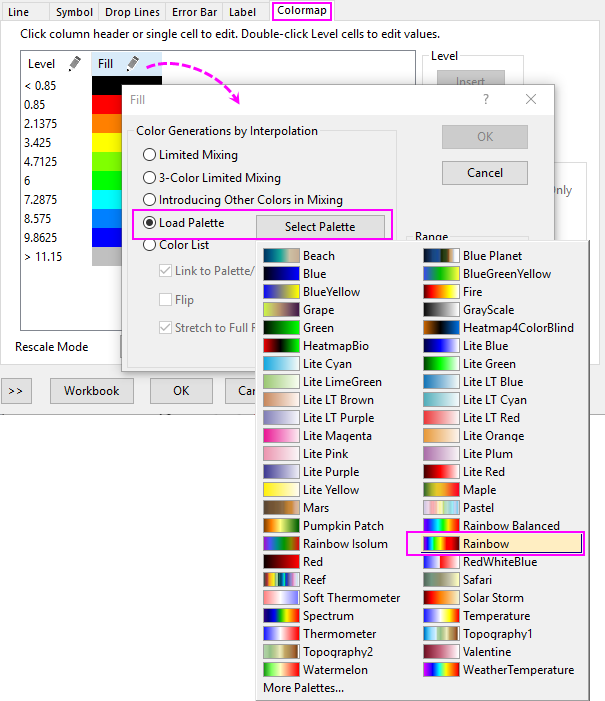
- In the Colormap tab, click on the column header Fill... to open the dialog. In the Fill dialog, choose Load Palette, click on Select Palette, and select Rainbow from the list.
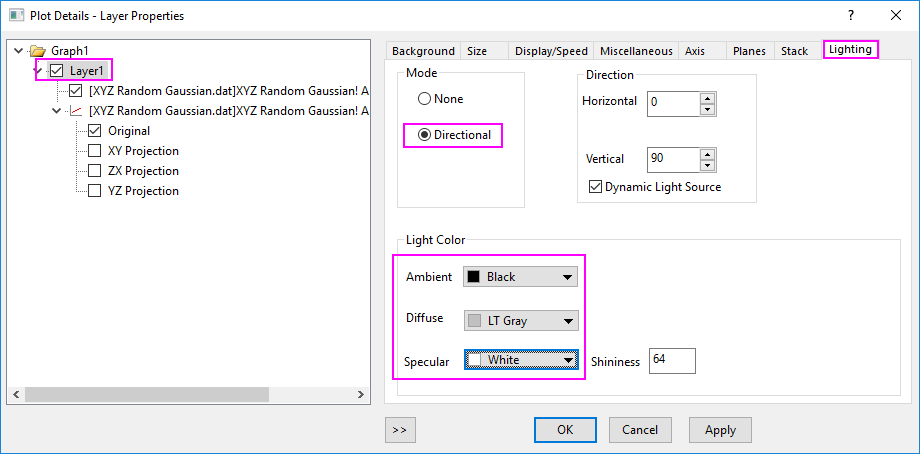
- Select Layer1 from the left panel of the Plot Details dialog. In the Lighting tab, select Directional as Mode and do the settings under Light Color just as the image below showing. Click OK to close the dialog.
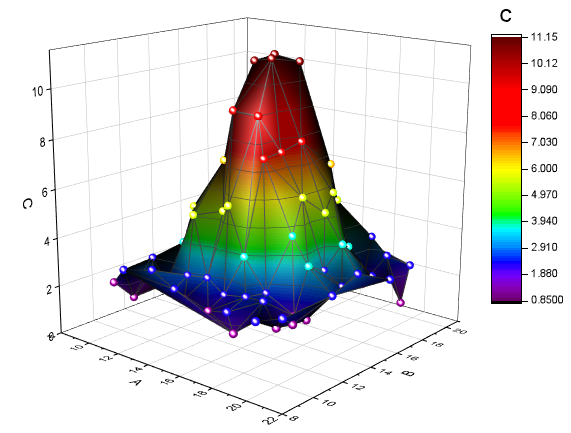
The graph should look as below:
 | Press the "S" key while hovering on a 3D openGL graph. The cursor will change modes. Drag with your mouse or use arrow keys to change lighting source direction.
|
Smooth the 3D surface plot
If you want to create a 3D surface that is smoother than the surface plot above(created from XYZ data), you can firstly convert the XYZ data into a matrix using the XYZ Gridding tool. And then, use the result Matrix data to create the 3D surface.
- Activate the workbook XYZ Random Gaussian again.
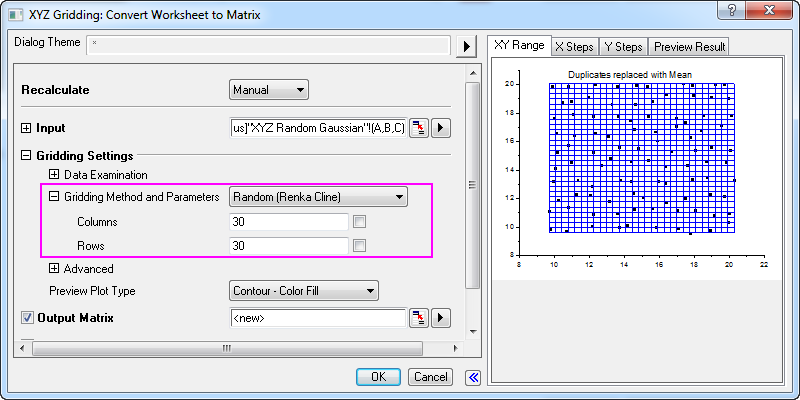
- Select Worksheet: Convert to Matrix: XYZ Gridding to open the dialog. Expand the Gridding Settings branch, select Random (Thin Plate Spline) from the Gridding Method and Parameters drop-down list, and set both the Columns and Rows to 30. Click OK to convert the XYZ data into a matrix.
- Activate the matrix, and select Plot > 3D: 3D Colormap Surface to create another 3D graph, says Graph2.
- Go back to Graph1, right-click on any white space in Layer frame to select Copy Format: All Style Formats in the context menu.
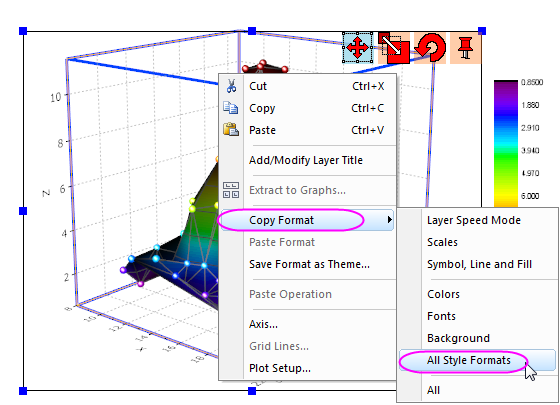
- Switch to Graph2 again, right-click on the Layer frame, select Paste Format in the context menu.
- Select Format: Plot... from main menu to open the Plot Details dialog. Go to Colormap/Contours tab, clear Enable Contours check box:
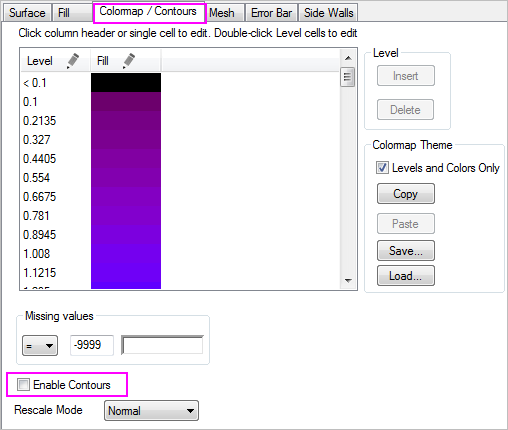
Graph2 should look as below:
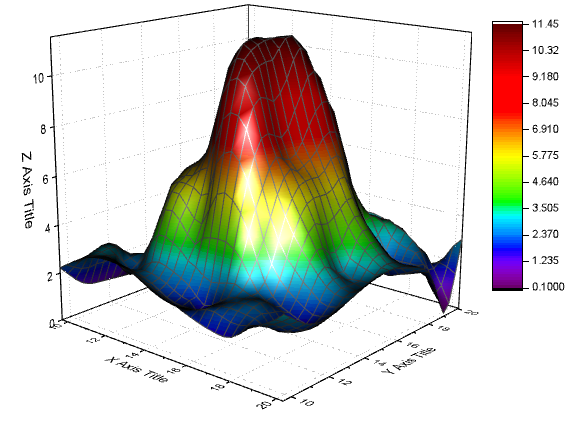
|