9.3.6.2 Customizing Waterfall GraphsCustomizeWaterfall
The Origin Waterfall graph plots one or more Y columns, or a range from one or more Y columns, as a series of line plots that "recede" into the page. Such graphs are effective for comparing datasets collected under conditions where some parameter is varied incrementally. Origin supports both 2D waterfall graph and 3D waterfall graph:
|
|
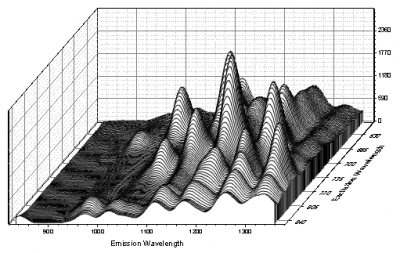
| GDI-based 2D Waterfall graph
|
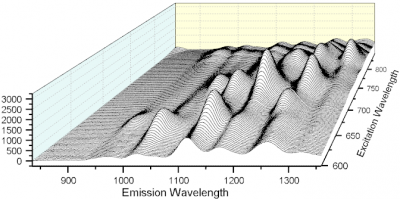
OpenGL-based 3D Waterfall graph
|
Change the view of graph
2D Waterfall: Resizing the plot and changing the plot viewing angle
There are two modes for graphical manipulation of waterfall plots:
- Click once on the graph and square handles appear at the layer corners.
- Click a second time on the graph and triangular handles appear at the layer corners.
The first click edit mode (square handles) allows you to move the layer's position on the page, to resize the layer and to change the viewing angle. When the cursor is a double-headed arrow, the graph's origin is fixed but you can change the layer dimensions and internal angles that define the edit box surrounding the waterfall plot. When the cursor is a four-headed arrow, you can move the layer on the page.
The second click edit mode (triangular handles) allows you to drag one of the triangular handles to skew the viewing angle without altering the length or position of the X axis (note that if you fail to place the cursor on a handle, then drag with your mouse, you will move the layer). Skewing of the plot can also be accomplished by editing the X Offset and Y Offset boxes on the Waterfall tab of the Plot Details dialog box (Format: Layer).
3D Waterfall: Rotating, Resizing, Stretching and Skewing the plot
3D waterfall is a specific 3D wall graph with wall width = 0. You can rotate, resize, stretch and skew the graph as other 3D graphs.
Display Attributes of Axis Titles, Tick Labels and Ticks
- 2D Waterfall: To display the Z axis title and Z tick labels in the axis plane, activate the graph and choose Format: Layer from the menu. In Plot Details, click on the Waterfall tab and check the In Plane Z Axis Title box.
- 3D Waterfall: To control the orientation of axis titles, ticks and tick labels, activate the graph and choose Format: Layer. In Plot Details, click on the Axis tab and choose an option for Orientation of Labels & Titles & Ticks.
- For both 2D and 3D Waterfall plots, the Z axis is labeled using column header row metadata. If there are numeric values in a worksheet column label row, those will be used by default, for labeling of the Z axis. If there is no appropriate row of numeric data, other column label row information will be used. Ultimately, the user controls which label row data are used for labeling the Z axis. For 2D graphs, use the Z Value Source drop-down list on the Waterfall tab (layer level) of Plot Details. For 3D graphs, use the Z Value Source drop-down list on the Miscellaneous tab (layer level) of Plot Details.
Color Map the Lines
For both 2D waterfall and 3D waterfall, the lines in the graph can be color mapped along the Y or Z direction. To create a color mapping waterfall graph, please refer to 2D Waterfall Y Color Mapping, 2D Waterfall Z Color Mapping, 3D Waterfall Y Color Mapping and 3D Waterfall Z Color Mapping.
Once you have created the color mapped waterfall graph, you can customize the mapping levels and colors. You can set the number of levels, color for each level, Theme for the color map, etc. Though the color mapping settings are the same, Y color mapping is for Y values and Z color mapping is for Z values, the former can make the color different for different Y values and the latter can make the color different for different Z values.
For more details on color mapping in waterfall graphs, please refer to this page.
Adding Symbols, and Line Connection Type
For 3D waterfall, Symbols can be added on each line. To create a 3D waterfall with Line + Scatter, please edit the Symbol properties in Symbol tab in Plot Properties dialog of the 3D Waterfall graph. You should set the Symbol size as nonzero (default size is zero), then specify the Symbol Type and Color, Click Apply to apply the settings.
To specify a line connection type (straight, spline, Bezier, Akima, etc.), click Format: Plot and on the Pattern tab, set the Connect drop-down.
Set Z Value Source
For both 2D waterfall and 3D waterfall, the offsets of the lines can be controlled by values in a worksheet Labels row, including Long Name, Comments, Units, Sampling Interval and Parameter, whose values are numeric only. Select a label row from the Z Value Source drop-down list to specify the worksheet Z value source row. For 2D waterfall, this is drop-down list is located on the Waterfall tab of Plot Details dialog; for 3D waterfall, this drop-down list is located on the Miscellaneous tab of Plot Details dialog.
Reverse Drawing Order
You can reverse the plotting order so the waterfall graph is drawn back to front:
- From the menu, choose Format: Axes: Z-axis.
- Reverse the Scale tab From and To settings.
Show Hidden Lines
For 2D Waterfall graph, there is a check box Show Hidden Lines in the Waterfall tab of Plot Details dialog which is used to specify whether or not show lines hidden by plots in the foreground.
For 3D Waterfall, you can set the Transparency of fill area or change the Fill Color to None in the Pattern tab of Plot Details dialog to show the hidden lines.
|