6.12.10 Multiple Surfaces in Same LayerMulti-3DSurf-in-Layer
Summary
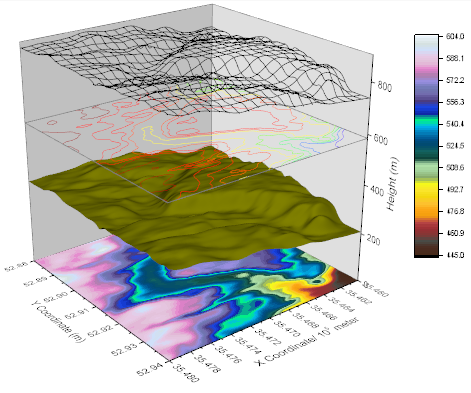
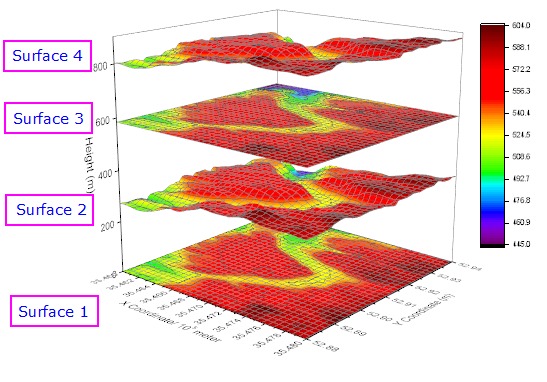
The four stacked surfaces shown below were created from the same matrix. The first layer from the top is a wire frame, the second layer is a flattened contour line plot, the third layer is a color filled surface with lighting effect, and the bottom layer is a flattened color filled contour plot.
Minimum Origin Version Required: Origin 2015 SR0
What You Will Learn
This tutorial will show you how to:
- Add multiple surface plots to a single graph layer
- Explore ways in which you can customize surface plots
Steps
Create a Graph with Multiple Surfaces
This tutorial is associated with <Origin EXE Folder>\Samples\Tutorial Data.opj.
Also, you can refer to this graph in Learning Center. (Select Help: Learning Center menu or press F11 key , and then open Graph Sample: 3D Surface)
- Open Tutorial Data.opj and browse to the Multiple Surfaces in Same Layer folder in Project Explorer (PE).
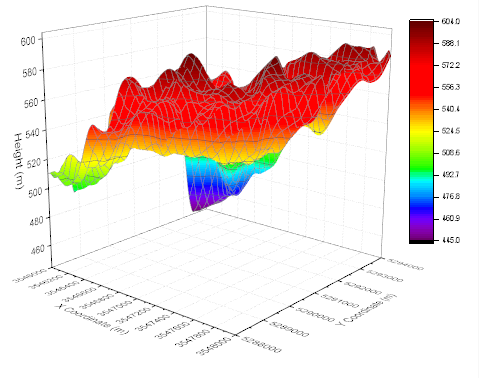
- Select the MBook8 worksheet and highlight all that data. From the Main Menu select Plot > 3D : 3D Colormap Surface. The graph window should appear as shown below:
-
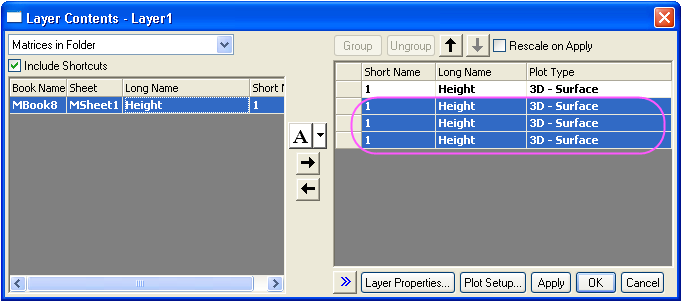
- With the new graph window active choose Graph: Layer Contents.... In the Layer Contents - Layer 1 dialog box, select the MBook8 matrix in the left panel and click the Add plot button (the right-pointing arrow in the center of the dialog) three times. Click OK. This will add the same MBook8 data to the graph layer four times. Note that at this point there only a single plot, the following steps will change that.
-
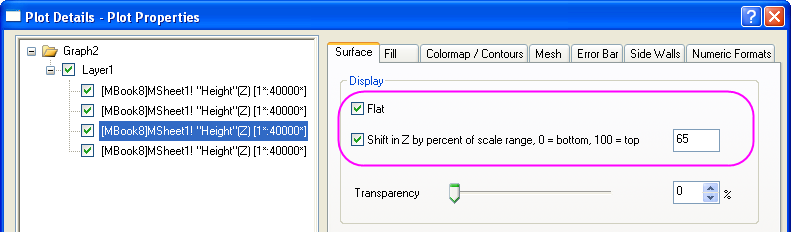
- Double-click on the plot to open the Plot Details - Plot Properties dialog box. Select the first plot in the left-hand panel and in the Surface tab check the Flat box, check Shift in Z by percent... and enter 0 in the accompanying text box. Select the second plot, leave Flat unchecked, check Shift in Z... and enter 23. Select the third plot, check Flat, check Shift in Z... enter 65. Select the fourth plot, leave Flat unchecked, check Shift in Z... and enter 82. Click OK.
-
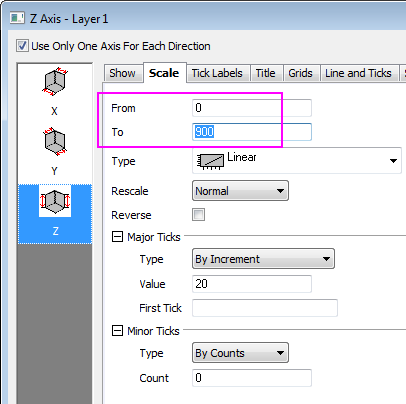
- Double-click on the Z axis, and in the Axes Dialog box, go to the Scale tab, make sure Z axis icon is selected and set From to 0 , and To to 900.
-
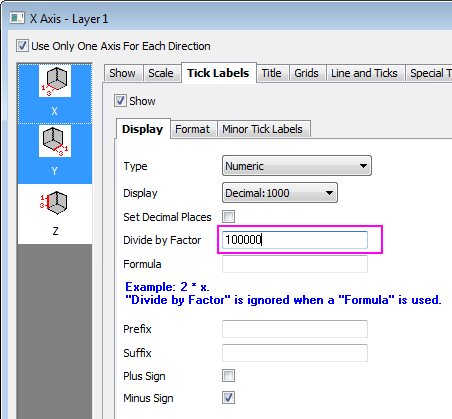
- Go to the Tick Labels tab, hold Ctrl key to select X and Y icons together. In the Display tab, for Divide by Factor, enter 100000.
-
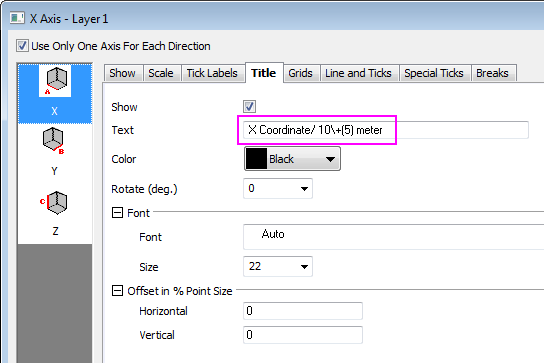
- Go to the Title tab, select the X icon and enter X Coordinate/ 10\+(5) meter as the text for X title. Select the Y icon and enter Y Coordinate/ 10\+(5) meter as title text.
-
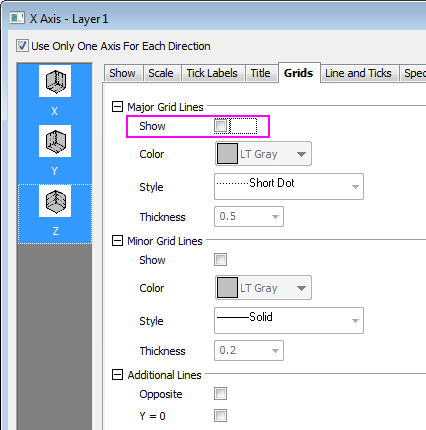
- Go to the Grids tab, hold Ctrl key to select X, Y and Z icons together. Under Major Grid Lines clear the Show check box to hide the grid lines for all axes.
-
- Click the OK button. The graph should now display four separate surfaces as shown below:
-
Customize the flattened color filled contour plot
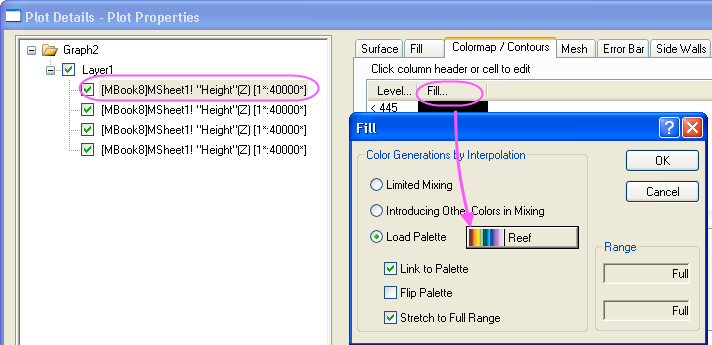
- Double-click on "Surface 1" to open the Plot Details dialog. Select the Colormap/Contours tab and click on the Fill... header to open the Fill dialog. In the Fill dialog, select Load Palette then click Select Palette and select the Reef palette. Click OK to close the Fill dialog.
-
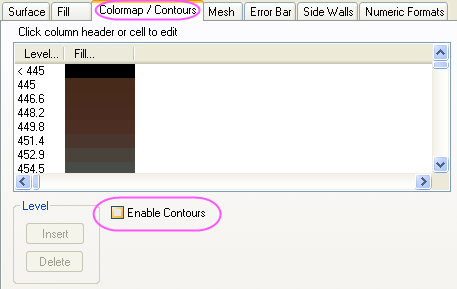
- In the Colormap/Contours tab, clear the Enable Contours check box.
-
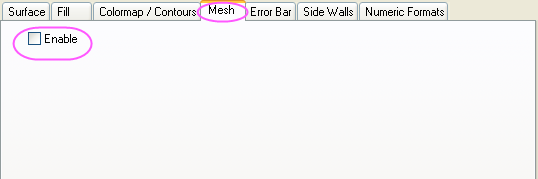
- Select the Mesh tab and clear the Enable check box.
-
- Click Apply to update your graph.
Customize the color filled surface
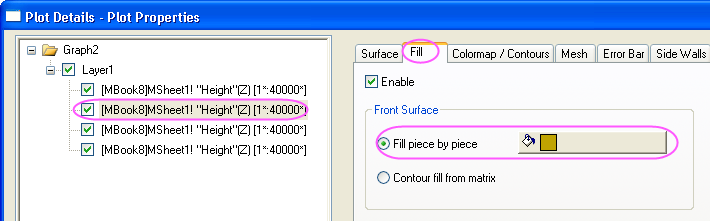
- Select the second data set (do not clear the accompanying check box), click the Fill tab, select Fill piece by piece and choose Dark Yellow from the drop-down.
-
- Select the Colormap/Contours tab and clear the Enable Contours check box.
-

- Select the Mesh tab and clear the Enable check box.
-
- Click Apply to update your graph.
Customize a flattened contour line plot
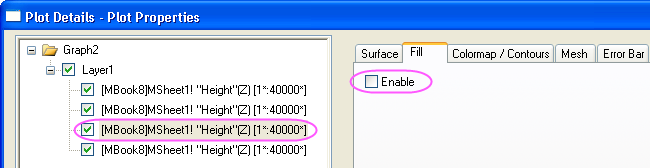
- Select the third data set, click the Fill tab and clear the Enable check box.
-
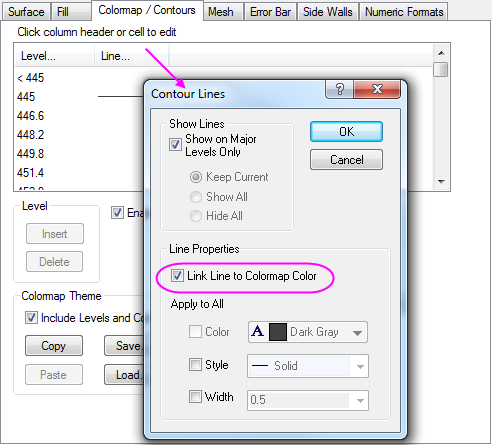
- Select the Colormap/Contours tab click on the Line... header to open the Contour Lines dialog. In this dialog, select the Link Line to Colormap Color checkbox. Click OK to close the Contour Lines dialog.
-
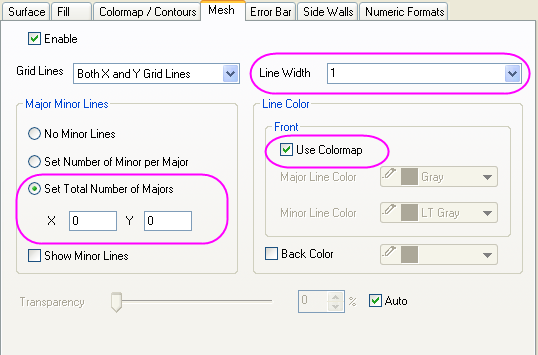
- Select the Mesh tab and set the Line Width to 1. In the Major Minor Lines section, choose the settings shown below and in the Line Color section select the Use Colormap check box .
-
- Click Apply to update your graph.
Customize a wireframe surface
- Select the fourth data set, click the Fill tab and clear the Enable check box.
-
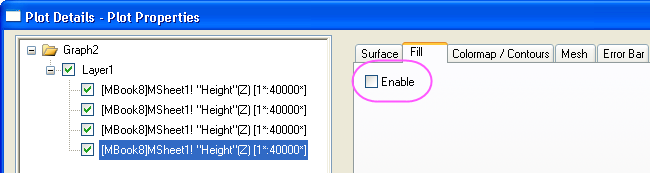
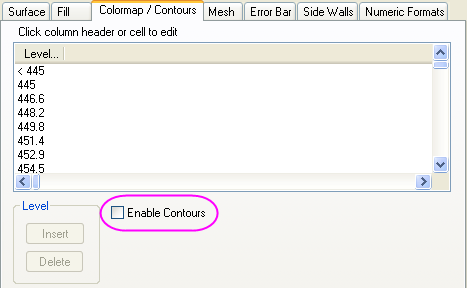
- Select the Colormap/Contours tab and clear the Enable Contours check box.
-
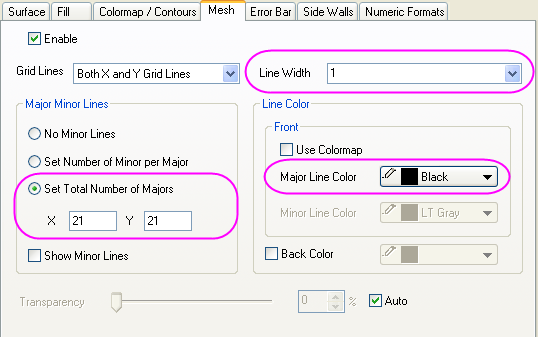
- Select the Mesh tab and set the Line Width to 1. In the Major Minor Lines section, choose the settings shown below and in the Line Color section set Major Line Color to Black .
-
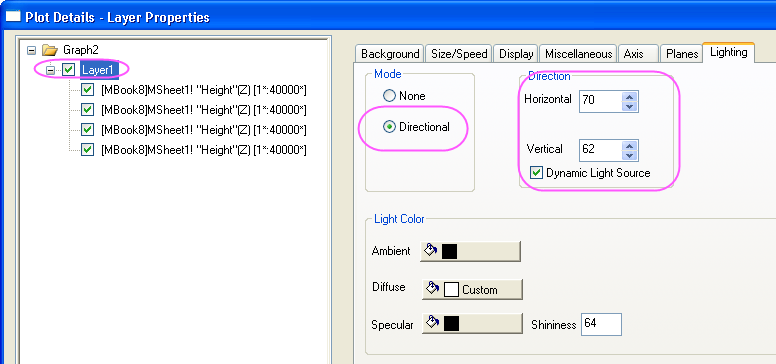
- Select Layer1 in the left panel. In the Lighting tab choose Directional for Mode and set the Direction group controls as shown below:
-
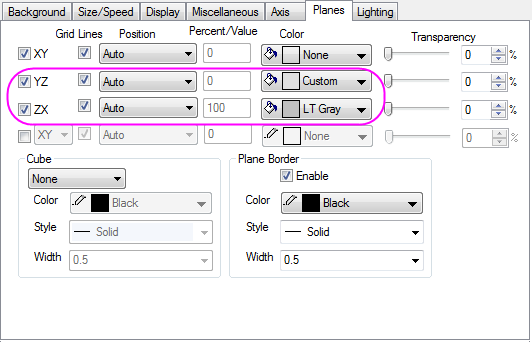
- Select the Planes tab. Specify the colors of the YZ and ZX planes as shown below (a custom color approximating "eggshell" for YZ and LT Gray for ZX works well).
-
- Click OK to update your graph.
- Rotate the 3D graph if you want to. Your graph should resemble the image shown below.
-
|