6.12.17 3D Ternary Colormap Surface with Contour Lines Projection3D-Ternary-Colormap-Surface
Summary
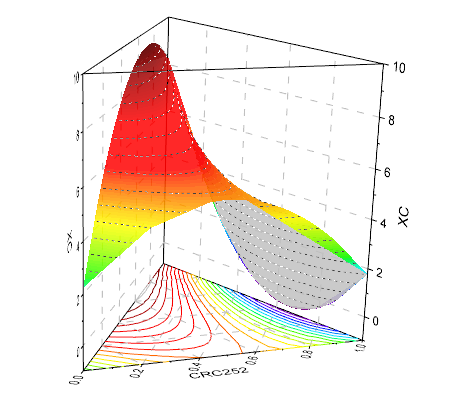
In this tutorial, a 3D ternary surface with Z colormap and its projection with contour lines are generated from XYZZ worksheet data.
Minimum Origin Version Required: Origin 2015 SR0
What you will learn
This tutorial will show you how to:
- Generate a 3D ternary surface plot with Z colormap.
- Project color-mapped contour lines onto the XYZ axis plane.
Steps
Creating 3D ternary surface
This tutorial is associated with the Tutorial Data project:<Origin EXE Folder>\Samples\Tutorial Data.opj.
- Open the Tutorial Data project and browse to folder 3D Ternary Surface.
- Activate the worksheet Ternary Surface in Book1F ,and highlight col(C) and col(D). Select Plot > 3D :3D Ternary Colormap Surface to generate a colormap surface.
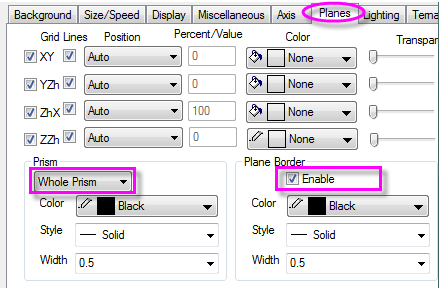
- We will modify the plot to show the edges of the 3D prism. Double-click on the plot to open the Plot Details dialog box. Highlight Layer1 in the left panel (take care not to clear the check mark beside the Layer1 icon). Go to the Plane tab, set Prism to Whole Prism and enable Plane Border.
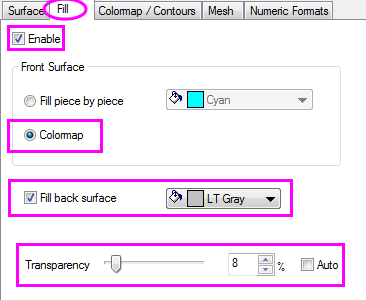
- Expand the Layer1 node, highlight the dataplot icon and click the Fill tab. Check Enable box and select Colormap. Check the box beside Fill back surface and set color as LT Gray.
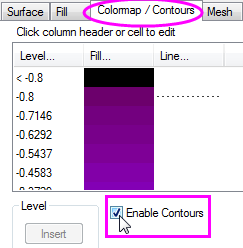
- Click the Colormap / Contours tab. Click the Level heading and in the Set Level dialog box, set controls as follows, then click OK to close the dialog box.
- To add contour lines on the ternary surface, check the box next to Enable Contours.
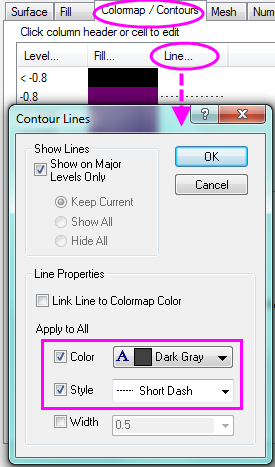
- To customize the contour lines, click the Line heading to open the Contour Lines dialog. Under Line Properties, check the box before Color and Style and set the Color as Dark Gray and Style as Short Dash, then click OK.
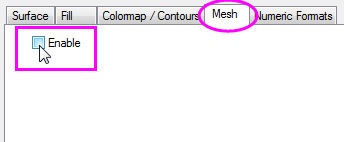
- Go to the Mesh tab, clear the Enable box, then click the OK button.
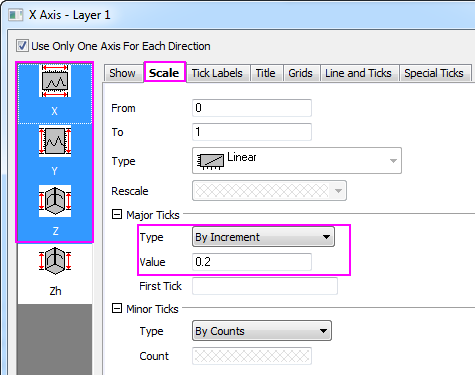
- To customize the scale and the major ticks of the X/Y/Z axes, click on a graph axis to open the Axis Dialog box. Expand the X, Y and Z nodes, then press CTRL while selecting Scale for the X ,Y and Z axes. Set Major Ticks > Value to 0.2.
- Expand the Zh axis node and select Scale. Duplicate the scale range and the Major Ticks > Value settings as shown below.
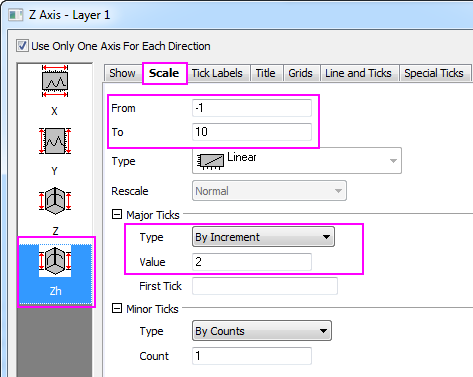
- Click OK to close the Axis Dialog box.
Creating projection with contour lines
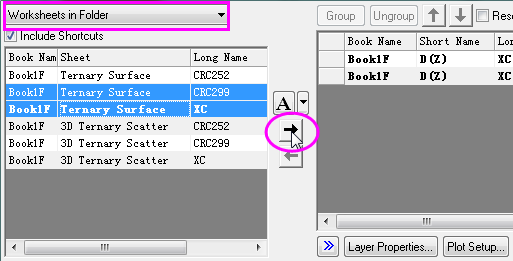
- With the graph page active, select Graph: Layer Contents from the main menu to open the Layer Contents dialog. Select Worksheets in Folder from the drop-down.
- To add another ternary surface to the graph, press CTRL and in the left panel, select the datasets XC and CRC299 of sheet "Ternary Surface", then click the Add plot button
 to add them to the right panel. Click OK. to add them to the right panel. Click OK.
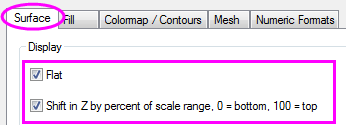
- Double-click on the plot to bring up the Plot Details dialog box. Under Layer1, click on the second plot, then click on the Surface tab. Under Display, choose Flat and Shift in Z by percent of scale range, 0 = bottom, 100 = top.
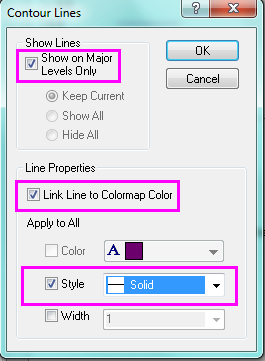
- On the Colormap / Contours tab, select Enable Contours. Click the Line heading and edit the Contours Lines dialog box settings as in the following image and then click OK.
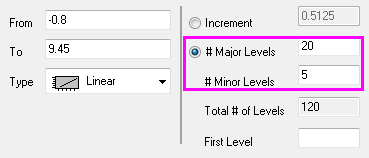
- On the Colormap / Contours tab, click the Level heading and in the Set Level dialog box, set # Major Levels to 20 and # of Minor Levels to 5. Click OK to close the dialog box.
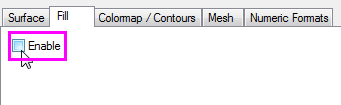
- Go to Fill tab and clear the Enable box.
- On the Mesh tab, clear the Enable box. Click OK to close the dialog box.
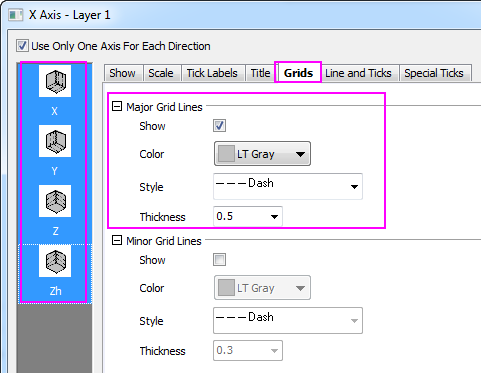
- To change the grid lines on the axis planes dashed lines, double click the axis to bring up the Axis Dialog box. In the left panel, expand the X node and select Grids. Press Select Others to choose grids for all the axis planes. Customize the Major Grid Lines section as follows:
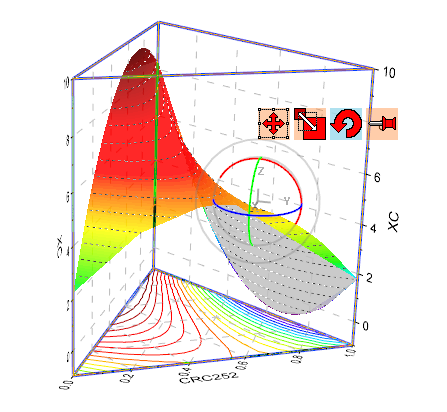
- Rotate the plot by dragging a hotspot (hint: click once inside the graph frame - but not on the plot -- to activate the move/resize/rotate functions). Alternately, you can use the tools on the 3D Rotation toolbar.
|