8.6.1.3 Linking Text Labels to Data and VariablesLinkVar-TextLabel
Text labels can as simple as a static literal text or LabTalk substitution notation string which does run-time string substitution to show a wide variety of project information, such as workbook, worksheet, column, cell values or metadata, data file info, or even data statistics, etc.
Some of the text labels are auto generated by Origin, such as axis titles, legends, data point labels, while others are manually added by the Text or Annotation tools. For manually added labels, please make sure the Link to Substitution is checked or set to 1 or above on Programming tab of Text Object dialog.
Within the context of the graph window, text labels can be lumped into two groups:
- Graph text labels: These include auto generated axis titles and graph legends, as well as labels added with the Text tool
 . We will mainly discuss labels added by Text tool here. See these pages for information on Graph Legends or Axis Titles. . We will mainly discuss labels added by Text tool here. See these pages for information on Graph Legends or Axis Titles.
- Data Plot Labels: These are labels applied to data points (single points or entire datasets) either using the Annotation tool or by enabling labels using Plot Details Label tab controls. See Labeling Data Points for information.
Substituting Worksheet Cell Values in Text Labels
The simplest way to show worksheet cell value in Text Labels is by copy and paste link.
- Click on a worksheet cell and press CTRL+C (or right-click and Copy).
- Use the Text tool to create your literal text (e.g. The value of y is:), then while still in label edit mode, right-click and choose Paste Link.
- Origin adds the worksheet cell subtitution notation for you.
A change to the worksheet cell value will trigger a change to the value shown in your label.
Though paste link is adequate for most users, it's still good to understand the worksheet cell Substitution to know what options there is in Origin.
For substitution to work, please first click on text label and check Link to Substitution on mini toolbar. Or right-click on the text label and choose Properties. On the Programming tab, set Link to (%,$), Substitution Level to 1 and click OK.
| Syntax
|
Description
|
Example
|
|
%(workbookName, Column, row#[, format])
|
column, row of active sheet in workbook
|
//book1, active sheet, 2nd column, 5th row, full precision
%(Book1,2,5)
//book1, active sheet, column B, row, 2 decimal places
%(Book1,B,5, .2)
|
| %([workbookName]Sheet, Column, row#[, format])
|
column, row of specified sheet in workbook
|
//book1, sheet1, 2nd col, 5th row, full precision
%([Book1]Sheet1,2,5)
//book1, sheet1, 2nd col, 5th row, 3 significant digits
%([Book1]Sheet1,2,5, *3)
|
| %(workbookName, @WL, column[row] [,format])
|
column, row of active sheet in workbook
|
//book1, active sheet, column 2, 5th row, full precision
%(Book1, @WL, 2[5])
//book1, active sheet, column B, 5th row
%(Book1,@WL, B[5], .2)
|
| %([workbookName]sheetName, @WL, column[row] [,format])
|
column, row of specified sheet in workbook
|
//show value of book1, sheet1, 2nd col, 5th row, full precision
%([Book1]Sheet1,@WL, 2[5])
//book1, sheet1, 2nd col, 5th row, same display as worksheet cell
%([Book1]Sheet1,@WL, B[5], W)
|
| %(plotindex, @WT, column, row[, format])
|
column, or of source worksheet of specified plot
|
//1st plot's worksheet, column F, row 5
%(1, @WT,F,5)
//2nd plot's Y data sheet, 6th col, 5th row, 2 decimal places
%(2Y, @WT,6,5, .2)
|
Note:
- The advantage of the @WT method is that the worksheet column that @WT refers is identified by plot source. When you save the graph as a Graph Template and reuse it later, the display content of the text label will automatically update according to the new data, even if dataset name is changed.
- The %(1, @WT,ColIndex,RowIndex) notation can be used to reference a matrixsheet value.
- format is optional. If skipped, it will use full precision. See supported Origin Formats.
- for @WL, the format can be W to use the cell format or column format in worksheet so WYSIWYG
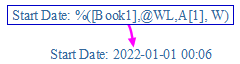
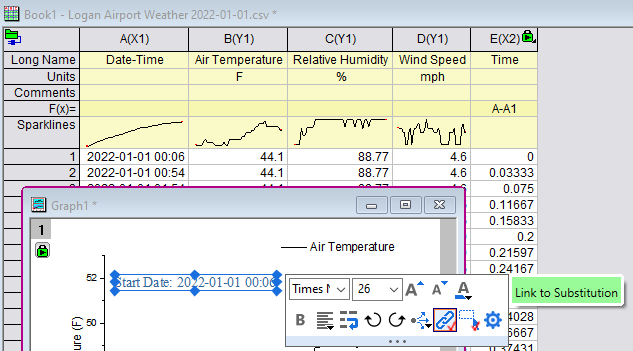
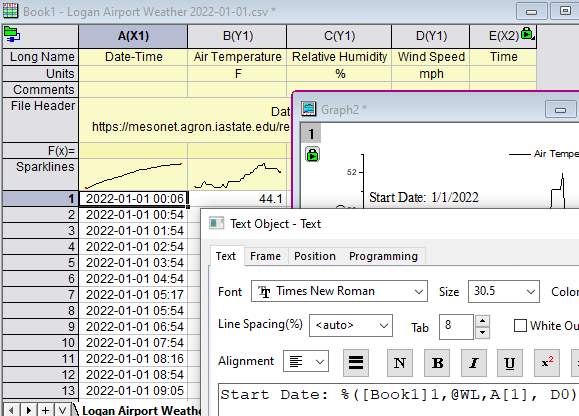
The following graph shows a text label of Start Date with a customized A1 cell value in MM/DD/YYYY format
Substituting Column Label Row Values (Metadata) in Text Labels
In addition to data row cells, you can substitute values from column label row cells in your text labels. Again, for substitution to work, click on text label and check Link to Substitution on mini toolbar. Or right-click on the text label and choose Properties. On the Programming tab, set Link to (%,$), Substitution Level to 1 and click OK.
There are several syntaxes that will work, depending upon your needs.
- %(PlotIndex, @option[,arguemnt] )
- %(PlotIndex[PlotDesignChar], @option)
- %(PlotIndex,@WT,ColIndex, LabelRowChar)
The last option uses a Column Label Row Character (LabelRowChar).
| Example
|
Description
|
| %(1, @LD"Mean")
|
User-defined parameter row value of 1st plot's column
|
| %(1, @LF, B)
|
1st plot's B column filter condition
|
| $(%(2Y, @LC), .2)
|
comment of 2nd plot's Y column, show 2 decimal places
|
| %(1X, @WT, 5, D2)
|
5th column's 2nd user-parameter row value on worksheet where 1st plot's X data is located
|
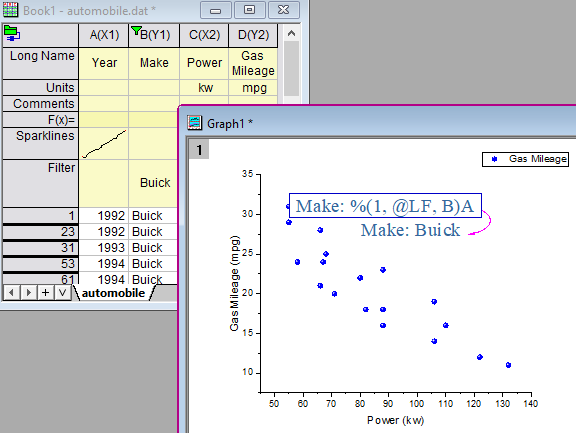
The following graph is plotted with column C and D. Text label shows column B's filter condition.
Substituting Dataset Statistics in Text Labels
You can also LabTalk functions to calculate dataset statistics and show the result in text label. Again, for substitution to work, click on text label and check Link to Substitution on mini toolbar. Or right-click on the text label and choose Properties. On the Programming tab, set Link to (%,$), Substitution Level to 1 and click OK.
The syntax is
- $(function(Dataset)[, format])
where
- the function should return a scalar value instead of a dataset, e.g. total(), mean(), etc.
- dataset can be string register for dataset or range variable, plot or worksheet column
- format is optional, see Origin Formats
The following table uses LabTalk function total() as an example. $( ) substitution is used to convert the calculation into a string with optional Origin format to customize the display.
| Dataset
|
Description
|
Example
|
| %C
|
String register for Active Dataset
|
$(total(%C)) //total of current dataset
$(total(%C), .2) //total of current dataset, show 2 decimal places
|
| %(plotindex, @D)
|
Dataset of specified plot
|
$(total(%(1, @D)) //total of 1st plot, for 2D, it refers to Y dataset
$(total(%(2X, @D)), *3) //total of 2nd plot's X dataset, show 3 significant digits
$(total(%(2.1, @D))) //total of 2nd layer, 1st plot's Y data
|
| %(plotindex, @WT, columnNameorIndex)
|
Dataset of specified plot
|
$(total(%(1, @WT, 5))) //total of 5th column on worksheet where the 1st plot is from
$(total(%(2X, @WT, E))) //total of column E on worksheet where 2nd X data is from
$(total(%(1, @WT, "Decay 2"))) //total of column (long name "Decay 2") on 1st plot's sheet
|
| %([book]Sheet, column)
|
Worksheet Column Substitution
|
$(total(%([book1]1, C )) //total of column C on 1st sheet of book1
|
| ds or ra
|
Dataset or Range variable or expression
|
$(total(ds)) //suppose dataset ds={1,2,3};
$(total({2,4,6})) //total of {2,4,6}
$(total(ra), .0) //suppose range ra=[book1]sheet1!B, show 0 decimal places
$(total([book1]1!C[5:0])) //total of range column C of Book1, 1st sheet, 5th row to end
|
The following text label calculate total value of the plot. The value is customized to use comma separator and 0 decimal places
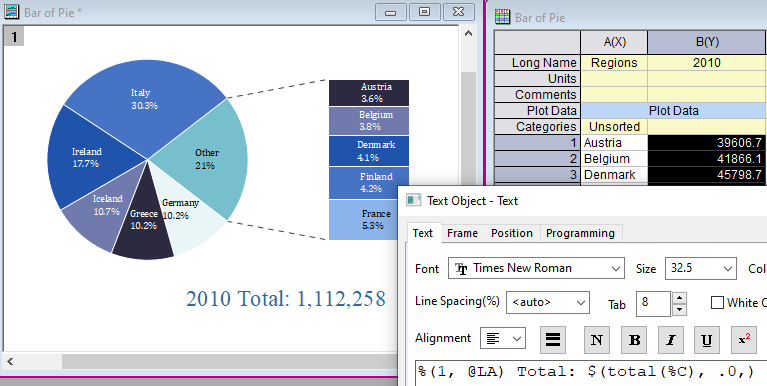
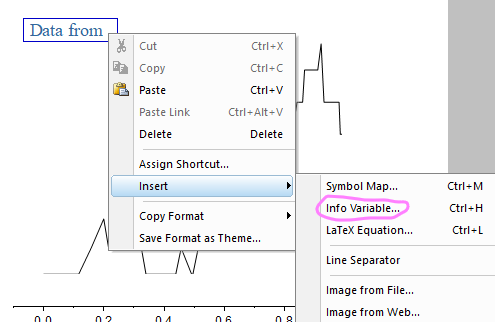
Substituting Info Variable in Text Labels
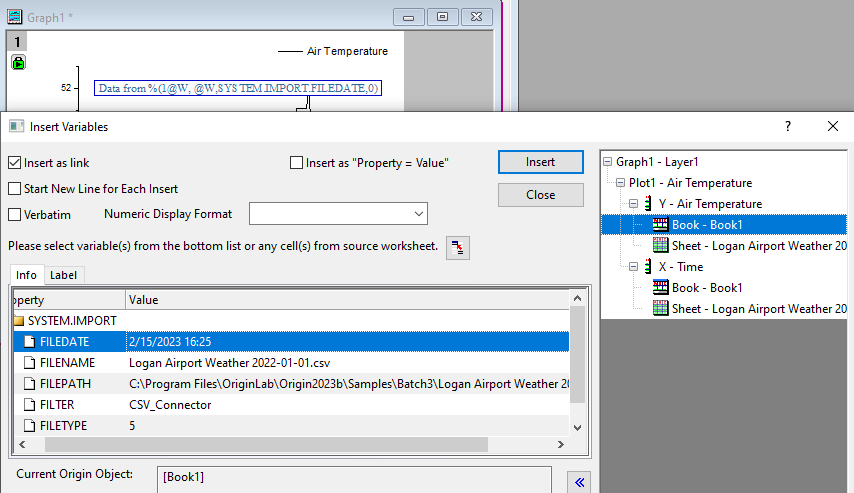
In in-place edit mode of text label, right click and choose Insert: Info. Variable (Ctrl+L) to insert information of plotted data's file, book, sheet, column information.
Select book, sheet or plot's X and Y column node on right. Then go to Info or Label tab to pick the info. to insert. By default it will be inserted with substitution notation.
Substituting Variable Values in Text Labels
Besides displaying worksheet values, you can include variable values in text labels. Again, for substitution to work, click on text label and check Link to Substitution on mini toolbar. Or right-click on the text label and choose Properties. On the Programming tab, set Link to (%,$), Substitution Level to 1 and click OK.
| Type
|
Example
|
Description
|
| String Register
|
%X%G.opju
|
show current project path and file name with .opju at the end
|
| String Variable
|
%(user$)
|
show string user$ content
|
| Numeric Variable
|
$(myvalue, .2)
|
show variable myvalue with two decimal place
|
Example 1. Use Reserved String Registers
String Registers are one means of handling string data in Origin and some are reserved system string registers that holds important information, such as project path %X, project file name %G, current active data %C, etc.
Assume that your current project MYPROJECT.OPJ is saved to C:\MYFILES\.
- Using WYSIWYG text labeling methods, type the following into a text label in a graph window:
- This project is saved to %X%G.OPJ.
- Exit the typing mode, right-click to select the label and choose Properties and go to Programming tab in the dialog.
- Set the Link to (%,$), Substitution Level list to 1.
- Go to Text tab and check the Verbatim check box (this causes the "\" character to be handled as a literal character instead of an escape character -- see below). The label should display the drive path and name of the current project.
- This project is saved to C:\MYFILES\MYPROJECT.OPJ.
For information on use of the Verbatim option see Use of the backslash "\" character in the Object Properties dialog box.
Example 2. Numeric Substitution
Using LabTalk, you can define any number of variables for use in your work. As an introduction to the concepts of "variables" and "scope", we recommend that you read this topic. To illustrate basic numeric substitution, we give the following simple example:
- On the main menu, click Window: Script Window.
- Click inside the Script Window and at the cursor, type:
MyVariable=5
and press Enter.
- From the Tools toolbar, select the Text Tool, click in an empty space on a graph or worksheet window and enter the following:
MyVariable=$(MyVariable)
- Right-click on the text label, choose Properties and go to Programming tab in the dialog, set the Link to (%,$), Substitution Level list to 1, then click OK. Your text label should now display the numeric value of MyVariable.
- MyVariable=5
 | To see a list of available LabTalk variables, open the Script Window (Window: Script Window) and click Tools: Variables... or type "ed" at the command line.
|
Resolving Math Expressions in Text Labels
We've seen that Origin supports substitution notation when creating text labels using the standard WYSIWYG text editing methods or when editing text in the Object Properties dialog box. You can also use this notation to resolve a mathematical expression to a value in the text label:
- $(expression)
In this substitution notation, expression is resolved to a value each time the text label is redrawn. The text label is redrawn whenever you move the label or redraw the graph window.
Example. Resolving pi in text label
- Type the following text in WYSIWYG edit mode or enter the expression in Text tab of the Object Properties dialog box and click OK.
- The value of X is $(pi^2)
- Right-click on your text label, select Properties... and go to Programming tab. Or, press the ALT key while double-clicking on the text label.
- Set Link to (%,$), Substitution Level to 1 and click OK. The label now reads:
- The value of X is 9.8696
You may need to click the Refresh button  on the Standard toolbar to see the change. on the Standard toolbar to see the change.
| When Origin starts, a text file in the program folder named ORGSYS.CNF is read. It is in this file that the value of pi is defined, in exactly the same way as you would define a constant or a variable at in the Script Window or the Set Column Values dialog box:
const pi = 3.141592653589793
If you have mathematical constants that you regularly use in your work, the CONST.CNF file under User File Folder is a good place to define them, as they will always be available when Origin runs (the .CNF file is a text file that you can edit in a simple text editor).
|
Adding Date-Time in Text Labels
There are a couple of ways to add date-time information as a text label, to your graph, worksheet, etc.
As a static text object
You can add a date and time stamp to the your graph by clicking the Date & Time button  on the Tools toolbar. on the Tools toolbar.
Note that this is a static text object and it will keep the current date-time until and unless you click the Date & Time button again.
See this FAQ for more information.
As a dynamic text object
There are a couple of ways to incorporate the current date-time into a text label. Unlike the Date & Time button, such a text label could be saved with your graph template and used to stamp the graph with the date and time of window creation. Note that when you save the template with a text object created using one of the following methods, you are saving the label's underlying code -- not the literal text of the current date-time.
The basic process would go like this:
- Customize your graph, including adding a date-time text object as described below.
- Save your custom template to your User Files folder.
- Select the data to be plotted and choose your custom template from Plot > My Templates.
Adding a date-time label using LabTalk substitution
Use the @D or @T syntax to add a date-time label to the graph:
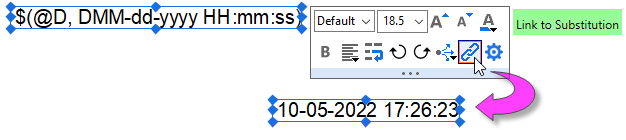
- Choose the Text Tool then click on the graph and enter the following at the cursor:
$(@D, DMM-dd-yyyy HH:mm:ss)
- Click off of the text object to exit edit mode.
- Select the text object and the click the Link to Substitution button on the Mini Toolbar.
| Note: The particular date-time format used here is just one example. To find out more about formatting for @D and @T, see this section of the LabTalk Reference.
|
Adding date-time by running LabTalk script in the label
This method works by adding a short line of script to the text object. That script is triggered on Window Create, thus stamping the graph with date-time that the graph is made.
- Choose the Text Tool then click on the graph and enter the following at the cursor:
%(dt$)
- Click off of the text object to exit edit mode.
- Right click on the text object and choose Properties.
- In the dialog, click on the Programming tab and recreate the following settings (the Text tab should also look as shown):
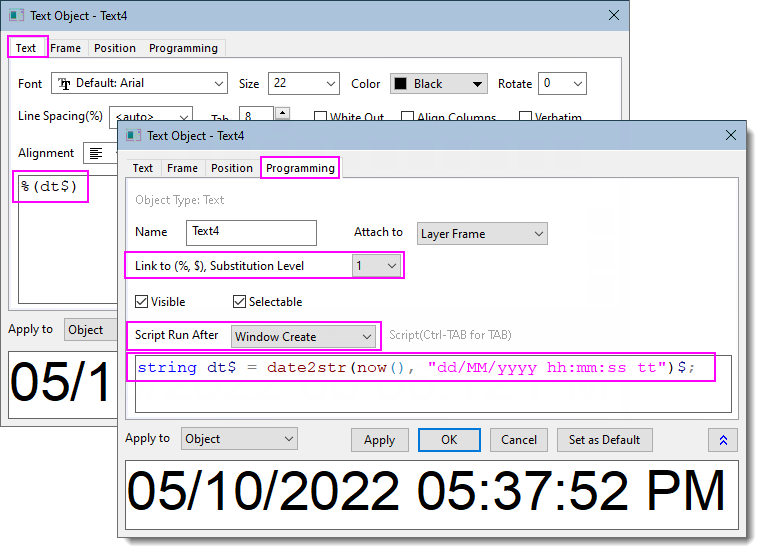
- Click OK to close the dialog and render the current date-time.
| Note: The combination of Origin date-time function and date-time format used here is just one example.
|
|