11.3 The Quick Peaks GadgetGadget-QuickPeaks
Overview
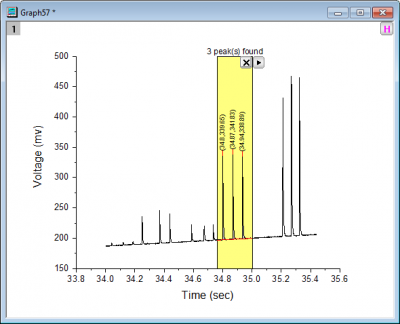
The Quick Peaks Gadget provides a quick and interactive way to perform peak analysis on data plotted in a graph. You can select an arbitrary range of the data plot using the region of interest (ROI) object displayed in the graph. Peak analysis results will update as the ROI is moved or resized.
With the Quick Peaks gadget, you can:
To Open Quick Peaks Gadget
To use this tool, select Gadgets: Quick Peaks from the Origin menu, when a graph is active. If the tool has already been activated, you can re-open the Quick Peaks dialog by clicking on the arrow in the upper-right corner of the ROI and choosing Preferences.
To Show or Hide Gadget Tool
To toggle the display of all gadget ROI boxes in a graph at the same time, click the H button  in the top right corner of the graph, which enables users to export the graph with gadget results. in the top right corner of the graph, which enables users to export the graph with gadget results.
ROI Box Tab
| X Scale
|
Specify the X Data range for the ROI.
- From
- The beginning of X scale.
- To
- The ending of X scale.
- Fixed (Prevent moving by ROI)
- Fix the X scale to prevent from moving by ROI box.
|
| Show Tool Name
|
Specify whether to show the tool's name near the top of the ROI.
|
| Show Number of Peaks on Center-Top
|
Specify whether to show the number of peaks on center-top of the ROI.
|
| Fill Color
|
Specify the filled color of the ROI.
|
Baseline Tab
| Mode
|
Specify the baseline mode. Options include:
- None (Y=0)
- Use Y=0 as baseline.
- Constant
- Use a horizontal line for baseline. You can specify the intercept of the horizontal line in the Constant control below.
- 2nd Derivative
- Use the 2nd Derivative method to create baseline.
- Use Existing Dataset
- Select an existing dataset as the baseline.
- Min&Max
- Use minimum Y as baseline to find positive peaks. Use maximum Y as baseline to find negative peaks.
- End Points Weighted
- Create a smoothed curve using data points from two ends.
- Straight Line
- Connect two end points of the data plot and connect them as baseline.
|
| Range
|
This is not available when the Mode is Straight Line. Specify how the baseline range shows on the ROI.
- Full Plot Range
- Create the baseline for the full plot range.
- Curve Within ROI
- Create the baseline only for the plot range within the ROI box.
|
| Fix x to
|
This is only available when the Mode is Straight Line. Specify how the straight line end points are decided.
- Entire Data
- The end points of the data plot are used
- Rectangle
- The end points at the boundaries of ROI box are used
- Scale
- The end points at the X axis scale are used
|
| Y Offset of Left
|
This is only available when the Mode is Straight Line. Specify the left end point offset on the Y axis scale.
|
| Y Offset of Right
|
This is only available when the Mode is Straight Line. Specify the right end point offset on the Y axis scale.
|
| Smoothing Method
|
Select smoothing method to create baseline. This option is only available when the Mode is set as 2nd Derivative.
- Window Size: Specify the desired window size (a positive integer) in the moving window for the Savitzky-Golay or Adjacent-Averaging smoothing.
- Threshold: Specify threshold for the Savitzky-Golay or Adjacent_Averaging smoothing.
- Polynomial Order: This parameter is available only when Savitzky-Golay is selected for Smoothing Method. It specifies the polynomial order (1 through 9).
|
| Maximum Anchor Points
|
Specify the maximum of baseline anchor points. This option is only available when you set Mode to 2nd Derivative.
|
| Connected Method
|
Specify connect method for the anchor points. This option is only available when you set Mode to 2nd Derivative.
|
| Constant
|
Use drop-down list to specify the intercept for the horizontal line to be used as the baseline.
- Minimum
- Set the intercept to the minimum value of the data.
- Maximum
- Set the intercept to the maximum value of the data.
- Mean
- Set the intercept to the mean of the data.
- Median
- Set the intercept to the median of the data.
- Custom
- When this option is chosen, specify the desired intercept for the horizontal line as baseline.
|
| Y=
|
Specify the customized intercept for the horizontal line as baseline. This option is only available when Constant is Custom.
|
| Dataset
|
Specify a dataset as baseline. This option is only available when Mode is set to Use Existing Dataset.
|
| End Points(%)
|
Specify the percentage of end points to create baseline. This option is only available when you set Mode as End Points Weighted.
|
Find Peak Tab
| Direction
|
Specify whether or not to find peaks with a specified direction only.
- Positive
- Find positive peaks only.
- Negative
- Find negative peaks only.
- Both
- Find both positive and negative peaks.
|
| Peak Finding Settings
|
Specify the settings for finding peaks.
- Method: Use this drop-down list to select the method to find the peaks.
- Local Maximum
- Use the Local Maximum method to find the peaks.
- Window Search
- Use the Window Search method to find the peaks.
- 1st Derivative
- Use the first derivative method to find the peaks.
- 2nd Derivative (Search Hidden Peaks)
- Use the 2nd Derivative method to find the peaks. This method is capable of detecting hidden peaks in the data.
- Residual (Search Hidden Peaks)
- Use the Residual after 1st Derivative method to find the peaks. This method is capable of detecting hidden peaks in the data.
- Local Points: This is available only when Local Maximum is selected in the Method drop-down list. It specifies the number of points in the local area, which will be used for finding the peaks with the Local Maximum method.
- Size Option: This is available only when Window Search is selected in the Method drop-down list. This drop-down list specifies how the Height and Width values (see below) are interpreted.
- Raw Size
- The values will be interpreted as raw sizes.
- Percent of Raw Data
- The values will be interpreted as the percentages with respect to the total width or maximum height of the spectrum data.
- Height: This is available only when Window Search is selected in the Method drop-down list. It specifies the height of the rectangle, which is used to find the peaks. There is an Auto check box to the right. If it is selected, it will determine the value automatically. Therefore, if you want to edit the value, please uncheck this check box.
- Width: This is available only when Window Search is selected in the Method drop-down list. It specifies the width of the rectangle, which is used to find the peaks. There is an Auto check box to the right. If it is selected, it will determine the value automatically. Therefore, if you want to edit the value, please uncheck this check box.
- Smooth Derivative: This is available only when 1st Derivative, 2nd Derivative (Search Hidden Peaks) or Residual (Search Hidden Peaks) is selected in the Method drop-down list. Specify the method to smooth the derivative of data (1st derivative or 2nd derivative).
- Method: Specify the smoothing method.
- None
- Do not use any smoothing method.
- Savitzky-Golay
- Specify the Savitzky-Golay method to get smooth derivative.
- FFT Filter
- Specify the FFT Filter method to smooth derivative. It is only available for 2nd Derivative (Search Hidden Peaks).
- Adjacent-Averaging
- Specify the Adjacent-Averaging method to smooth derivative. It is only available for 2nd Derivative (Search Hidden Peaks).
- Quadratic Savitzky-Golay
- Specifies the Quadratic Savitzky-Golay method to smooth derivative. It is only available for 2nd Derivative (Search Hidden Peaks).
- Polynomial Order: It is available for Savitzky-Golay and Quadratic Savitzky-Golay methods to specify the polynomial order.
- Points of Window: It is available for Savitzky-Golay, Adjacent-Averaging and Quadratic Savitzky-Golay methods. The greater this value, the greater the degree of smoothing. A value of zero for this parameter will leave the data unsmoothed.
- Cut Off Frequence: It is available only for FFT Filter method. It specifies the cutoff frequency.
|
| Peak Filtering
|
Specify how to filter peaks.
- Method: Use this drop-down list to specify whether you want to limit the number of found peaks or the height of the peaks.
- None
- Select this option if you do not want to limit the number of found peaks nor the heights of the peaks.
- By Height
- When you select this option and specify a threshold height with the Threshold Height(%) text box, only the peaks whose heights are not less than the threshold height will be found.
- By Number
- If you select this option and enter a value in the Number of Peaks text box, you can limit the number of peaks that will be found.
- Threshold Height(%): This text box is available only when By Height is selected in the filter Method drop-down list. You can use it to specify the minimum height of the found peaks. It is a percent of a reference value, which is defined as follows: First, get the maximum value and the minimum value of the data (if a baseline has been subtracted from it, use the data after subtraction). Then compare the absolute values of the maximum value and the minimum value. The greater one will be regarded as the reference value of the Threshold Height. There is an Auto check box to the right. When it is selected, the smooth points will be determined automatically. If you want to specify the height, make sure the clear this check box.
- Number of Peaks: This text box is available only when By Number is selected in the filter Method drop-down list. You can use it to specify the maximum number of the found peaks. There is an Auto check box to the right. When it is selected, the smooth points will be determined automatically. If you want to specify the number of peaks, make sure the clear this check box.
|
| Peak Display
|
Peak Marker: Whether to show peak marker.
- Color: The color of peak marker.
- Size: The size of peak marker. This drop-down list allows typing a number not listed there.
Peak Label: Whether to show peak label.
- Label: What label of the peak to show, includes three options:
- X of Peaks: Show only X scale of the peak as peak label.
- Y of Peaks: Show only Y scale of the peak as peak label.
- (X,Y) of Peaks: Show both X and Y scales of the peak as peak label.
 | If you have applied a Formula to axis tick labels, you can display the formula-adjusted tick value as opposed to the actual data (scale) value using the Numeric Display Format box on the Plot Details Label tab.
|
Base Marker: Whether to show base marker. Note that when more than 100 peaks are found, no base marker will show even though it is checked.
- Color: The color of base marker.
- Size: The size of base marker. This drop-down list allows typing a number not listed there.
|
| Tag Peak and Base as
|
- Data Plot
- If this is selected, later if you select Tag Peaks from the gadget fly-out menu, the tagged peak labels will be automatically created as a data plot and added to the original graph.
- Marker
- If this is selected, later if you select Tag Peaks from the gadget fly-out menu, the tagged peak labels will be only added as data marker. But you can right click on the data marker(move mouse over and right click when mouse turn to crossing) and choose Convert to Data Plot to convert data marker into data plot.
|
Area Tab
| Integration from
|
Select how to integrate the peaks, from Beaseline or Y=0.
|
| Show Integrated Area
|
Select if show the integration area of found peaks in the ROI box. Note that when more than 100 peaks are found, no integration area will show even though it is checked.
|
Output to Tab
| Script Window
|
Specify whether to output the results to the Script Window.
|
| Results Log
|
Specify whether to output the result to the Results Log.
|
| Append to Worksheet
|
Specify whether to append the results to a worksheet.
|
| Result Worksheet Name
|
This is only available when Append to Worksheet is selected. It is used to specify the name of the worksheet.
- When you generate new output, results are output to [%H-QkPeak]Result by default (here %H means the Short Name of source graph), but other books and sheets can be specified. If the book and sheet do not exist, they will be created on output.
- Alternately, you can click the flyout button
 to the right of Result Worksheet Name and choose Sheet in Input Book. This fills the edit box with [<input>]Result. When you generate new output, results are output to a sheet named Result in the source book. to the right of Result Worksheet Name and choose Sheet in Input Book. This fills the edit box with [<input>]Result. When you generate new output, results are output to a sheet named Result in the source book.
|
| Tag Info Worksheet Name
|
Specify the output sheet name to store the tag information.
If on the Find Peak tab:
- Tag Peak and Base as is set to Data Plot, a new worksheet with specified name will be created with tag info data when output is generated. Accept the default [%H-QkPeak]Tag or click the flyout button to the right of Tag Info Worksheet Name and choose Sheet in Input Book. This fills the edit box with [<input>]Tag. When you choose New Output (O), results will be output to a sheet named Tag in either the QkPeak book, or in the source book. Alternately, you can type a [BookName]SheetName into the field. If the book and sheet do not exist, they will be created when you generate new output.
- Tag Peak and Base as is set to Marker, the worksheet will not be created because Marker does not have associated data.
|
| Output Baseline to Worksheet
|
Specify to output the baseline to worksheet.
|
| Baseline Worksheet Name
|
- When you generate new output, results are output to [%H-QkPeak]Baseline by default, but other books and sheets can be specified. If the book and sheet do not exist, they will be created on output.
- Alternately, you can click the flyout button to the right of Result Worksheet Name and choose Sheet in Input Book. This fills the edit box with [<input>]Baseline. When you generate new output, results are output to a sheet named Baseline in the source book.
|
Quantities Tab
| Output Quantities
|
Specify what data to output.
- Dataset Identifier
- Specify a dataset identifier in the drop-down list.
- Peak ID
- Peak ID, something like "Peak 1", "Peak 2", etc.
- Peak Row
- The row index of the peak center.
- Peak X
- The X scale of the peak.
- Peak Y
- The Y scale of the peak.
- Height
- The height of peak, calculated from baseline.
- Peak Area
- The peak area that is calculated by integrating the raw peak data from the baseline or Y=0 (depending on the selection in the Integrate From drop-down list under the Area tab). The integration range is marked out by Base Marker on Find Peak tab, which is not identical to the range covered by ROI box.
- FWHM
- The full width at half maximum height or the peak width at half the peak's maximum value.
- Centroid
- The peak centroid or gravity center, which is defined as:
dx}{\int_{0}^{\infty}F(x)dx}")
- Left Half Width
- The left half width. If we draw a line for
 , this line will intercept with the input data at two points. Let's denote them as , this line will intercept with the input data at two points. Let's denote them as ") and and ") , where , where  . Also, we denote the peak center as . Also, we denote the peak center as ") . Then we can compute the left half width as: . Then we can compute the left half width as: 
- Right Half Width
- The righthalf width. If we draw a line for , this line will intercept with the input data at two points. Let's denote them as and , where . Also, we denote the peak center as . Then we can compute the right half width as:

- Left Base Marker Row
- The row index of the left base marker.
- Left Base Marker X
- The X scale of the left base marker.
- Left Base Marker Y
- The Y scale of the left base marker.
- Right Base Marker Row
- The row index of the right base marker.
- Right Base Marker X
- The X scale of the right base marker.
- Right Base Marker Y
- The Y scale of the right base marker.
- Info
- The information of the baseline, which is an embedded notes window. ‘’’Note’’’: when input data is larger than 1000 points, baseline data will not output to Notes. Please select ‘’’Output Baseline to Worksheet’’’ to see the baseline data.
|
Fly-out Menu
| New Output
|
Output results to the specified worksheet (if not empty, append the results).
|
| New Output for Entire Curve
|
Output results for all peaks in the active plot to the specified worksheet (if not empty, append the results).
|
| New Output for All Curves (N)
|
Output the results for all curves in the current layer to the specified worksheet (if not empty, append the results).
|
| New Output for All Layers (L)
|
Output the results for all curves in all layers within the current graph to the specified worksheet (if not empty, append the results).
|
| Subtract Baseline
|
Subtract the specified baseline from source data in the ROI box.
|
| Go to Report Worksheet
|
Activate the report worksheet, if there is one.
|
| Output to Clipboard
|
When selected (menu item checked) New Output will be placed on the Clipboard.
|
| Tag Peaks
|
Tag the found peaks and add the peak labels for found peaks as a label plot or data markers into the original graph. The labels will still exist even after closing the gadget. When the peaks are added as data marker, they can be used by the Multiple Peak Fit (menu is Analysis: Peaks and Baseline: Multiple Peak Fit) tool.
|
| Fit Peaks
|
Fit the found peaks by specifying a fitting function.
|
| Switch to Peak Analyzer
|
Switch to Peak Analyzer to fit the found peaks. More details about fitting peaks in Peak Analyzer, please refer to this help page.
|
| Update Output
|
Update the output, and the original results will be clear, then add the current results. This is applicable only when you have output the peak values.
|
| Change Data
|
Change the source data set. This is applicable only when there are multiple curves on the graph layer.
- Click on any plot to select.
- Click Select... or More... to open the Select Plot(s) browser.
- By default, the Auto mode will be checked in the fly-out menu, which means the target data/plot will follow the data plot selection/highlighting outside the ROI box on the graph. In Origin 2019 and earlier versions, Origin doesn't support this auto behavior; to change the target plot/data, you have to select from the fly-out list or the Select Plot(s) dialog.
Please note, when you change the source data/target plot, the peak markers and peak labels of found peaks will automatically show on the newly-selected plot, following the settings in the Find Peaks tab. If you need keep the peak markers and labels on current plot, please select Tag Peaks from the fly-out menu.
|
| Expand to Full Plot(s) Range
|
Expand the ROI box to full plot range.
|
| Fix ROI Position
|
Fix the ROI position, then you cannot move it any more.
|
| Save Theme
|
Save theme for the dialog settings.
|
| Save as <default>
|
Save the current dialog settings as default theme.
|
| Load Theme
|
Load the existed theme to apply the dialog settings.
|
| Preferences
|
Open the Quick Peaks Preferences dialog, which is similar with the one when starting the gadget by selecting menu Gadgets: Quick Peaks.
|
|