11.9 The Interpolate GadgetGadget-Interpolate
Overview
The Interpolate Gadget performs quick interpolation on a ROI (Region of Interest) range.
With this gadget, you can:
- Easily interpolate data points on a rectangular region with the linear, cubic spline or cubic B-spline method.
- Quickly find out an interpolated Y value from any given X value.
- Output the interpolated values to Script Window, Result Log or a specified worksheet.
To Use Interpolate Gadget
To use this tool, select Gadgets: Interpolate from the Origin menu, when a graph is active.
Dialog Settings
This dialog can be opened from Gadgets: Interpolate in the Origin menu, or by selecting Preferences from the ROI fly-out menu.
| ROI Box
|
X Scale
- Specify the X data range for the ROI.
- From
- The beginning X scale value.
- To
- The ending X scale value.
- Fixed (Prevent moving by ROI)
- Fix the X scale to prevent rescaling when moving the ROI box.
Show Tool Name
- Specify whether to show the tool's name near the top of the ROI.
Fill Color
- Specify the ROI fill color.
Interpolation Line Color
- Specify the color of the interpolation line.
Interpolation Line Width
- Specify the width of the interpolation line.
|
| Show on Center-Top of ROI Box
|
Choose the quantities to be displayed at the top of the ROI box.
- Y at Left
- The Y value that corresponds to the left edge of the ROI.
- Y at Right
- The Y value that corresponds to the right edge of the ROI.
- Y at Specified X
- The Y value that corresponds to an X value which you specify in the X edit box.
- X
- This edit box is available only when the Y at Specified X check box is checked.
|
| Interpolate/Extrapolate Options
|
Method
- Specifies the interpolation/extrapolation method. Options include:
- Linear
- Linear interpolation is a fast method of estimating a data point by constructing a line between two neighboring data points.
- Cubic Spline
- This method splits the input data into a given number of pieces, and fits each segment with a cubic polynomial. The second derivative of each cubic function is set equal to zero. With these boundary conditions met, an entire function can be constructed in a piece-wise manner.
- Cubic B-Spline
- This method also splits the input data into pieces. Each segment is fitted with discrete Bezier splines.
- Akima Spline
- This method is based on a piecewise function composed of a set of polynomials. The akima interpolation is stable to outliers.
- Please see the algorithm here.
Number of Points
- Specify the number of interpolation/extrapolation points.
Boundary
- Boundary condition is available when Method is Cubic Spline. Options include:
- Natural
- The 2nd derivatives are 0 on both ends.
- Not-A-Knot
- The 3rd derivatives are continuous on the second and last-second point.
Smoothing Factor
- Available when Method is Cubic B-Spline. A non-negative parameter that specifies the smoothness of the interpolated curve in Cubic B-Spline interpolation. The factor helps user control the balance between smoothing and fidelity to the actual data. Larger values will result in smoother curves.
Fit Limits To
- Specify the interpolation curve boundary.
- Interpolate to Rectangle Edge
- Interpolate to the ROI edges. If the ROI range is larger than the source data range, the interpolation will stop at the edge of the source data.
- Interpolate/Extrapolate to Rectangle Edge
- Interpolate/Extrapolate to the ROI edges, regardless of the source data range.
- Data Points
- Interpolate between the specified data points, which are enclosed by the ROI rectangle.
- Interpolate/Extrapolate to Full Axis Edge
- Interpolate/Extrapolate to the full X axis scale range in the input graph, regardless of the source data range.
- Custom
- Interpolate/Extrapolate to a customized data range, specified by the Left and Right value.
|
| Output To
|
Specify the output result worksheet:
- When you generate new output, results are output to [%H-Interpolate]Result by default (here %H means the Short Name of source graph), but other books and sheets can be specified. If the book and sheet do not exist, they will be created on output.
- Alternately, you can click the flyout button
 to the right of Result Worksheet Name and choose Sheet in Input Book. This fills the edit box with [<input>]Result. When you generate new output, results are output to a sheet named Result in the source book. to the right of Result Worksheet Name and choose Sheet in Input Book. This fills the edit box with [<input>]Result. When you generate new output, results are output to a sheet named Result in the source book.
|
Fly-out Menu
Click the triangle button  at the top right corner of the ROI tool to open the fly-out menu. Menu commands include: at the top right corner of the ROI tool to open the fly-out menu. Menu commands include:
| New Output
|
Output results to the specified worksheet.
|
| New Output for All Curves (N)
|
Output the results for all curves in the current layer to the specified worksheet (if not empty, append the results).
|
| New Output for All Layers (L)
|
Output the results for all curves in all layers within the current graph to the specified worksheet (if not empty, append the results).
|
| Go to Report Worksheet
|
Activate the report worksheet.
|
| Change Data
|
Select the source data set. This is applicable only when there are multiple curves on the graph.
- By default, Auto mode is enabled. When Auto is enabled, plot selection is controlled by clicking on a plot in the graph window or Object Manager. Prior to Origin 2019, Origin did not support Auto; to change target plot/data in older versions, you must select a plot from the fly-out menu.
- Place a check mark in front of any plot to select that plot.
- Click Select... or More ... to open the Select Plot(s) dialog and change selection.
|
| Expand to Full Plot(s) Range
|
Expand the ROI to the full plot(s) range.
|
| Fix ROI Position
|
Fix the position of the ROI.
|
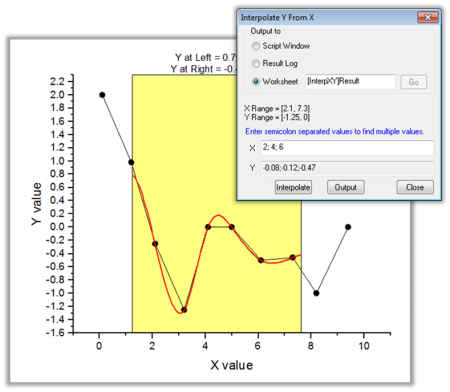
| Interpolate X/Y
|
Open the Interpolate Y from X dialog. You can enter multiple X values and the tool will output the interpolated Y values for each of them.
|
| Save Theme
|
Save the settings as a Theme.
|
| Save as <default>
|
Save the settings as default Theme.
|
| Load Theme
|
Load settings from a Theme file.
|
| Preferences
|
Open the Interpolate Preferences dialog.
|
|