8.6.2 Creating and Editing Drawing ObjectsCreate-Draw-Objects
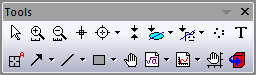
Add drawing objects to your Origin windows with buttons on the Tools toolbar.
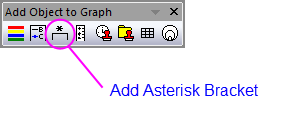
Additionally, you can "asterisk brackets" -- bars indicating statistical groupings -- using the Add asterisk bracket button on the Add Object to Graph toolbar.
Drawing straight lines or arrows
To add a straight line or arrow to the graph window:
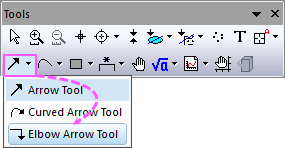
- Click on the Line tool
 or Arrow tool or Arrow tool  . Click-and-drag at the desired location in the graph window. Release the mouse button and the line or arrow is displayed. . Click-and-drag at the desired location in the graph window. Release the mouse button and the line or arrow is displayed.
- To draw a vertical or horizontal line or arrow, press the SHIFT key as you drag with the Line tool or Arrow tool . You will see that the line snaps to the horizontal or vertical. When it is oriented properly, release the mouse button.
| Note: If you want to draw a vertical or horizontal line within the layer frame, select Insert: Straight Line: Open Dialog menu to open the Straight Line: addline dialog. In this dialog, you can add a vertical or horizontal line to current graph layer by specifying the position value, line format, label format, line selectivity and mobility.
|
To edit the line:
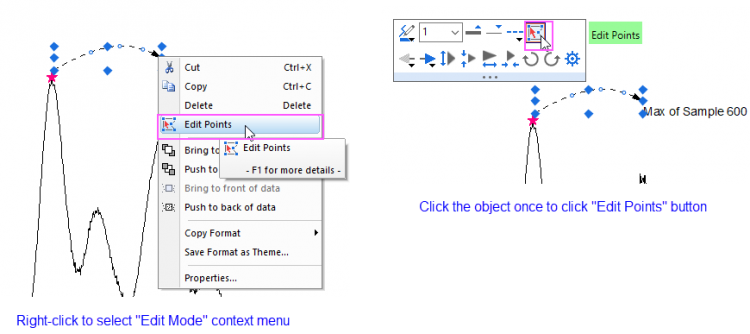
- To adjust the begin or end point of the line, single click once on the point, then it will show the solid symbols for the bigin and end points of the line. When the cursor on the point, you can change the begin or end points of the line by draging the points. You also can click Edit Points mini toolbar button
 or select Edit Points context menu to enter the Edit Points mode. or select Edit Points context menu to enter the Edit Points mode.
- To move or resize it, twice click once till diamond handles show. Drag to move it or drag the handles to resize it. Press Ctrl key down while dragging the handles will keep aspect ratio of the curve.
- Press Shift key or Ctrl + Shift key down while editing any point for existing line/arrow object, the angle of the line will be maintained
- To rotate it, single click 3 till circle handles show around it. Drag the circle handle to rotate it. Drag the cursor in the middle of the shape to change center of rotation.
- To skew it, single click 4 times till triangle handles show around the shape. Drag the triangle handle to skew it.
- Double click curve to open Properties dialog to customize line, arrow head(s), dimension, or code when clicking/moving/resizing the curve, etc.
Drawing curved arrows
To add a curved arrow to the graph:
- Click the Curved Arrow tool
 . .
- Click in four places along the intended arc to locate the curved line's anchor points -- place the first click at the beginning of the curve, the second two clicks along the curve, and the final click at the point where you want the arrow head. After the fourth click, Origin displays the curved arrow. The points are connected with a Bezier curve.
To edit the curved arrow:
- To move or resize it, single click once till diamond handles show. Drag to move it or drag the handles to resize it. Press Ctrl key down while dragging the handles will keep aspect ratio of the curve.
- To rotate it, single click twice till circle handles show around it. Drag the circle handle to rotate it. Drag the cursor in the middle of the shape to change center of rotation.
- To skew it, single click 3 times till triangle handles show around the shape. Drag the triangle handle to skew it.
- You can also single click 4 times, or click Edit Points mini toolbar button , or select Edit Points context menu to enter the Edit Points mode to adjust the trace of the curve.
- Double click curve to open Properties dialog to customize line, arrow head(s), dimension, or code when clicking/moving/resizing it, etc.
Drawing elbow arrows
To add a elbow arrow to the graph:
- Click the Elbow Arrow tool
 under the Arrow button group in Tools toolbar. under the Arrow button group in Tools toolbar.
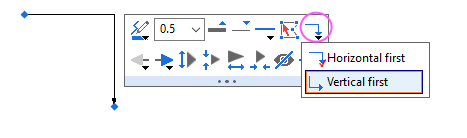
- Click the place of start point and then drag&drag the line to the end point. During the drawing, you can press Shift key to switch the direction: Horizontal first or Vertical first.
To edit the elbow arrow:
- Single click on the arrow, or select the arrow to click Edit Points mini toolbar button , or select Edit Points context menu to enter the Edit Points mode to adjust the trace of the elbow line.
- Single click the arrow to select it and the click the Diretion mini toolbar button
 to switch the direction of the elbow line. to switch the direction of the elbow line.
-
- To move or resize it, click twice once till four diamond handles show. Drag to move it or drag the handles to resize it. Press Ctrl key down while dragging the handles will keep aspect ratio of the elbow line.
- To rotate it, single click triple till circle handles show around it. Drag the circle handle to rotate it. Drag the cursor in the middle of the shape to change center of rotation.
- To skew it, single click 4 times till triangle handles show around the shape. Drag the triangle handle to skew it.
- Double click curve to open Properties dialog to customize line, arrow head(s), dimension, or code when clicking/moving/resizing it, etc.
Adding a Distance Annotation
To add a distance annotation:
- Click on the Distance Annotation tool
 (Tools toolbar). (Tools toolbar).
- Click on the graph and drag out an arrow between two points on the graph.
- Press the Shift key while dragging to force the arrow to snap to vertical or horizontal.
- Distance annotations will also snap to data points > axes > line objects (including reference lines). Press Ctrl to prevent snapping.
To edit the distance annotation:
A label is automatically attached to the arrow object. The default label syntax is $(v,.2) -- which resolves to the distance between two points, reported to two decimal places. Alternately, the user can modify the label to show horizontal (e.g. $(dx,.2)) or vertical (e.g. $(dy,.2)) distance between two points; or even $(dy/dx,.2) to report line slope.
- Double-click on the label to enter edit mode and modify syntax, as needed.
- To reposition the annotation, click to select and drag one or both of the blue selection handles. Note that you may need to refresh the graph window to get the label to update (click the Refresh button
 on the Standard toolbar). on the Standard toolbar).
Adding a Angle Annotation
To add a Angle Annotation:
- Click on the Angle Annotation tool
 (Tools toolbar). (Tools toolbar).
- Single-click 3 times to create segment, vertex and the another segment. Then an Arc shows between two segments. A label with angle shows in the center point of arc.
To edit the Angle Annotation:
- To change the angle of this object, click on the object, then single click on diamond handles show. Drag to move it to change the angle. And the angle degree label will also be changed with the angle changing.
- A label is automatically attached to center point of arc. The default label syntax is $(v,.2) -- which shows the angle between two segments. Double-click to modify the syntax, e.g. $(v, .3) to show 3 decimal places, $(v*pi/180, .2) to convert degree to radian and show 2 decimal places.
- Double click Angle Annotation to open Properties dialog to customize line, arrow head(s), dimension, arc or code when clicking/moving/resizing it, etc.
- Click on the
 button on Mini toolbar, the arrow will show on the Arc. button on Mini toolbar, the arrow will show on the Arc.
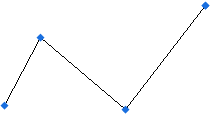
Drawing Polylines (segmented lines)
To draw a polyline:
- Click on the Polyline tool
 (Tools toolbar), then click once at each intended anchor point. (Tools toolbar), then click once at each intended anchor point.
- Terminate the polyline by double-clicking with the mouse or hitting ESC or pressing Enter key.
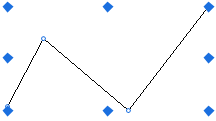
To edit the polyline:
- To adjust the turning point of the polyline, single click once on the polyline, then it will show the solid symbol for the turning points. Move the cursor on the point, then you can change it's positon by draging the point. You also can click Edit Points mini toolbar button or select Edit Points context menu to enter the Edit Points mode to adjust the points of polyline.
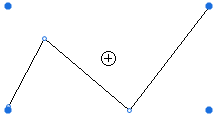
- To move or resize it, single click twice till diamond handles show. Drag to move it or drag the handles to resize it. Press Ctrl key down while dragging the handles will keep aspect ratio of the line.
- To rotate it, single click 3 till circle handles show around it. Drag the circle handle to rotate it. Drag the cursor in the middle of the shape to change center of rotation.
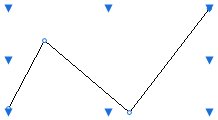
- To skew it, single click 4 times till triangle handles show around the shape. Drag the triangle handle to skew it.
- Double click polylin to open Properties dialog to customize line, arrow head(s), dimension, fill or code when clicking/moving/resizing it, etc.
Drawing smooth curve
To draw a smooth curve:
- Click on the Curve tool
 (on the Tools toolbar), then click once at each intended anchor point. (on the Tools toolbar), then click once at each intended anchor point.
- Terminate the curve by double-clicking with the mouse or hitting ESC or pressing Enter key.
To draw a closed curve:
- Click on the Curve tool (on the Tools toolbar), then click once at each intended anchor point.
- Move the cursor around begin point, it will snap the point to begin. At this time single click, drawning will finish with a closed curve.
To edit the curve:
- To move or resize it, single click once till diamond handles show. Drag to move it or drag the handles to resize it. Press Ctrl key down while dragging the handles will keep aspect ratio of the line.
- To rotate it, single click twice till circle handles show around it. Drag the circle handle to rotate it. Drag the cursor in the middle of the shape to change center of rotation.
- To skew it, single click 3 times till triangle handles show around the shape. Drag the triangle handle to skew it.
- You can also single click 4 times, or click Edit Points mini toolbar button , or select Edit Points context menu to enter the Edit Points mode to adjust the trace of the curve.
- Double click polylin to open Properties dialog to customize line, arrow head(s), dimension, fill or code when clicking/moving/resizing it, etc.
Drawing freehand lines
To draw a freehand line:
- Click on the Freehand Draw tool
 . .
- Click once and hold while dragging out your line.
- Release the mouse button to complete the operation.
To edit the freehand line:
- To move or resize it, single click once till diamond handles show. Drag to move it or drag the handles to resize it. Press Ctrl key down while dragging the handles will keep aspect ratio of the line.
- To rotate it, single click twice till circle handles show around it. Drag the circle handle to rotate it. Drag the cursor in the middle of the shape to change center of rotation.
- To skew it, single click 3 times till triangle handles show around the shape. Drag the triangle handle to skew it.
- You can also single click 4 times, or click Edit Points mini toolbar button , or select Edit Points context menu to enter the Edit Points mode to adjust the trace of the line.
- Double click curve to open Properties dialog to customize line, arrow head(s), dimension, or code when clicking/moving/resizing it, etc.
Drawing two-dimensional objects
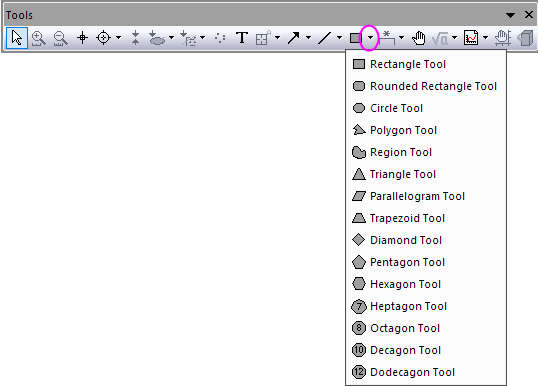
To add a square, rectangle, circle, oval, polygon or region
- Click the respective button on the Tools toolbar:
- For all objects but the polygon, click-and-drag at the desired location in the graph window. Release the mouse button to display the object.
- For polygons, single click to draw corners of the polygon. Double click at the last corner.
- To draw a perfect square or circle instead of rectangle/oval, press Ctrl key while dragging.
- Rounded Rectangle, Triangle, Parallelogram, Trapezoid, Diamond, Pentagon, Hexagon, Heptagon, Octagon, Decagon, Dodecagon are supported from 2025b version.
To edit the object:
- To move or resize the objects single click once till diamond handles show around the object. Drag to move it or drag the handles to resize it. Press Ctrl key down while dragging the handles will keep aspect ratio of the shape.
- To rotate the object, single click twice till circle handles show around the object. Drag the circle handle to rotate it. Drag the cursor in the middle of the shape to change center of rotation.
- To skew the object, single click 3 times till triangle handles show around the shape. Drag the triangle handle to skew it.
- For polygon and region, you can single click 4 times, or click Edit Points mini toolbar button , or select Edit Points context menu to enter the Edit Points mode(get handles along the border) to adjust the shape further.
- For the Rounded Rectangle, single click on the object, then it shows a red anchor point on the border. Click on this anchor point and drag it to change the radius for rounded corner.

- For the Triangle, Parallelogram and Trapezoid, single click on the object, then it shows a anchor point (red point) on the border. Click on this anchor point and drag it to change the shape of these object.
- For the Trapezoid, we supply a Isosceles Trapezoid button
 on the Mini Toolbar. Be default, this button is checked. When uncheck it, it will show two anchor points on the trapezoid, then you can change distance of left or right separately. on the Mini Toolbar. Be default, this button is checked. When uncheck it, it will show two anchor points on the trapezoid, then you can change distance of left or right separately.
- Double click the object to open Properties dialog to customize border, fill, position, or code when clicking/moving/resizing it, etc.
Editing Objects
A drawn object has four possible edit modes, produced by repeated, slow-clicks on the object.
- The order of modes may differ for some objects but the selection-handle shape will indicate which mode is active.
- If you disable an edit option (i.e. Disable group, Dimensions tab of Properties), the associated edit mode will not be available as you click sequentially through edit modes.
| Mode
|
Description
|
|
Point Edit
- Square selection handle. Move individual points.
|
|
Resizing
- Diamond selection handle. Move selection handles in either allowed dimension (e.g. if you disable Vertical Movement, you will not be able to resize in the vertical dimension).
|
|
Rotating
- Round selection handle. Rotate the object around the axis of rotation (i.e. the crosshair).
|
|
Skewing
- Triangular selection handle. Enable skewing of the object.
|
More Controls for Entering Edit Points Mode
In order to enter the edit points mode to adjust the shape of drawing objects(include the ROI box of analysis tool), besides signle-clicking on the object four times, you can simply right-click on the object to select Edit Points context menu or click the Edit Points mini toolbar button.
Copying and pasting objects
This is supported for a single object or multiple objects.
To copy the object:
- Click on the object or drag a box around the object with the Pointer tool
 (selection handles will appear). (selection handles will appear).
- To select multiple objects, click 1st object, then press CTRL or SHIFT key down and continue the selection. Or you can drag a big box around all the objects you want to select.
- Press Ctrl+C, select Edit: Copy menu or right click the select object and choose Copy context menu.
To paste the object:
- Click once where you want the object to be pasted, then choose Edit:Paste or press CTRL + V to paste the object. or right click on where you want to paste and select Paste context menu.
- Origin 2025 introduces hotkey Ctrl+Shift+V to paste to the exactly same location as the original one(s). On new graph object(s) will be pasted to exactly same location. On same graph, objects will overlap the original object at same location.
 | - After selecting multiple object, you can click Group toolbar button on Object Editor toolbar to group them. Then in the future, click a single object will select all in the group. Paste will paste them as group still. You can ungroup them afterwards to edit each object separately.
- Prior to Origin 2018b, pasted objects were, by default, positioned behind the last pasted object. In Origin 2018b and later, pasted objects are positioned in front of the last pasted object. You can change the order of overlapping objects by right-clicking on the object and choosing one of the object ordering options from the shortcut menu.
|
Copying Line Objects and Pasting Data to a Worksheet
Any of the line objects - line, arrow, curved arrow, polyline or freehand -- can be used to generate an XY dataset:
- Select the line object in the graph, then right-click and choose Copy.
- Click on an empty worksheet cell, right-click and choose Paste.
A set of XY coordinates will be created in the worksheet.
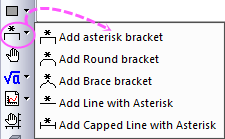
Adding Asterisk Brackets Indicating Groupings on Statistical Charts
It is common, particularly in the life sciences, to create column or bar charts and use an "asterisk bracket" object to indicate significant differences. Brackets can be added to an Origin graph using the Add asterisk bracket button group  (Add Object to Graph toolbar). This group supports 5 bracket types. You can click the down-arrow next to the button to select the bracket type you desired: (Add Object to Graph toolbar). This group supports 5 bracket types. You can click the down-arrow next to the button to select the bracket type you desired:
- Click the Add asterisk bracket button , then draw a rectangle on the graph to add the object. Note: You can press Shift key to change the direction of the bracket during drawing.
- Select the object then reposition it by dragging with your mouse.
- Use the blue handles to size and position the bracket "legs".
- Use the red handles to add curvature to bracket "shoulders".
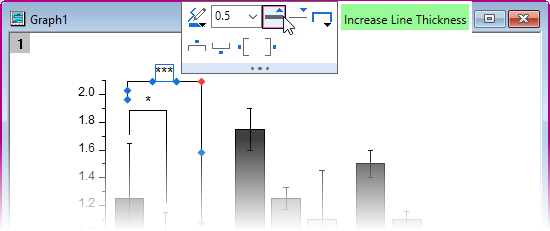
- Note that you can manually edit the text block in the center of the bracket to add asterisks (*), p-values, etc.
- Once selected, you can also use the bracket's Mini Toolbar buttons to orient the bracket, modify line thickness, bracket type, etc.
| - In the versions before Origin 2025b, clicking the bracket button will create a bracket object with default size at default place on the graph. Since Origin 2025b, another mode has been intruduced as the default behavior: After clicked the bracket button, draw a rectangle to position the bracket with desired size. To switch the modes, you can set the system variable @BDM.
- The line cap shape (round, square, flat) is controlled by LabTalk system variable @LCG.
For information on changing the value of a system variable, see this FAQ.
|
|