8.4.2.7.2 The Title and Format Tab for Other Special GraphsAxesDialog-TitleFormat-Tab 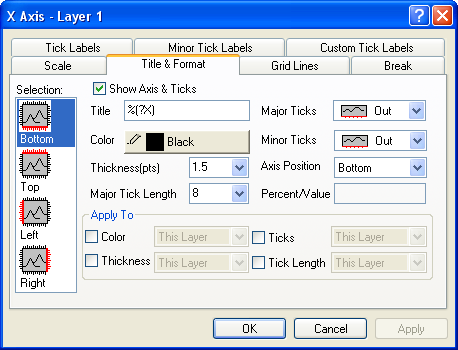
Selection
| Horizontal
|
This is, by default, the bottom and top X axes. However, if you have exchanged the X and Y axes (Graph:Exchange X-Y Axis) or if you are editing an axis of a bar, floating bar, or stacked bar graph, then the Horizontal icon is associated with the left and right Y axes.
|
| Vertical
|
This is, by default, the left and right Y axes. However, if you have exchanged the X and Y axes (Graph:Exchange X-Y Axis) or if you are editing an axis of a bar, floating bar, or stacked bar graph, then the Vertical icon is associated with the bottom and top X axes.
|
| Z Axes
|
This is, by default, the front and back Z axes.
|
| Bottom
|
This is, by default, the bottom X axis (except if the X and Y axes have been exchanged or if you are editing bar-style graphs).
|
| Top
|
This is, by default, the top X axis (except if the X and Y axes have been exchanged or if you are editing bar-style graphs).
|
| Left
|
This is, by default, the left Y axis (except if the X and Y axes have been exchanged or if you are editing bar-style graphs).
|
| Right
|
This is, by default, the right Y axis (except if the X and Y axes have been exchanged or if you are editing bar-style graphs).
|
| Front
|
This is, by default, the front Z axis.
|
| Back
|
This is, by default, the back Z axis.
|
After you finish editing the properties of an axis, you can begin editing any other axis in your graph by selecting the appropriate icon from the Selection list box. To prevent your selections from applying to your graph, click the Cancel button at any time during the editing process (but before clicking Apply).
Show Axis & Ticks
Select this check box to display the axis and ticks for the current axis Selection. Conversely, to hide the axis and ticks, clear this box.
Title
Type an axis title in this text box.
Color
Select an axis and tick color from this drop-down list.
Thickness (pts)
Type or select the desired line thickness (in points, where 1 point=1/72 inch) for the axis and ticks from this combination box.
Major Tick Length
Type or select the desired major tick length (in points, where 1 point=1/72 inch) from this combination box.
Major Ticks
Control the display of the major ticks from this drop-down list.
Minor Ticks
Control the display of the minor ticks from this drop-down list.
Axis Position & Percent/Value
| Bottom (X), Top (X), Left (Y), Right (Y), Front (Z), or Back (Z)
|
Move the axis back to its default location.
|
| % from Bottom (Top, Left, Right, etc.)
|
Offset the axis from its default location. Type a "percent-of-axis-length" value in the Percent/Value text box.
For axes in 2D graph layers, type a positive value to move the axis away from the center of the page; type a negative value to move the axis toward the center of the page.
|
| At Position=
|
Position the axis at a specific X or Y axis scale value. Type the X or Y value in the Percent/Value text box.
|
Apply To
Select the Color check box to apply the current selection from the Color drop-down list to: This Layer, This Window, or All Windows (in the current project).
Select the Thickness check box to apply the current selection from the Thickness (pts) combination box to: This Layer, This Window, or All Windows (in the current project).
Select the Ticks check box to apply the current selection from the Major Ticks and the Minor Ticks drop-down lists to: This Layer, This Window, or All Windows (in the current project).
Select the Tick Length check box to apply the current selection from the Major Tick Length combination box to: This Layer, This Window, or All Windows (in the current project).
|