12.2.1 Specifying Your Input DataAnalyDialog-SpecifyInput
Origin's analysis tools permit you to specify your input data in several ways -- by pre-selecting data in your worksheet; by typing in a data range; by selecting from a list; or using the tool's interactive range selection control. Where appropriate, data range selection is also flexible, in that you can select data from one or more worksheet columns, parts of worksheet columns or even non-contiguous portions of worksheet columns.
Most users will find it easiest to pre-select input data before opening an analysis tool. In doing so, you will initialize the appropriate data input fields, saving yourself the bother of having to do this once the tool is opened. For example, you can highlight a worksheet Y column or some rows in a Y column, and then open the Linear Fit tool. The input data branch of the tool will be initialized with the pre-selected data and you can then go on to specify other fitting options, click the OK button, and perform your linear fit. If multiple Y columns were selected, each column will be listed under Input Data as a separate range (which you can accept or adjust as needed). Note, that not all analysis tools will work with multiple range selections. For example, the smooth tool (Analysis: Signal Processing: Smoothing) works with only one XY range at a time.
Auto initialization of the Input Data branch of the analysis tools also applies to graphed data. If you open an analysis tool when a graph window is the active window, the active curve in the active layer is pre-selected for analysis. You can also select just a portion of a curve or multiple curves (where appropriate) before opening an analysis tool. This does not prevent you from adding to or removing curves from the analysis after the dialog box has been opened. If no curve is active when an analysis tool is opened, the Input Data branch will be empty. For information on specifying data ranges in the graph, see Selecting Data in the Graph.
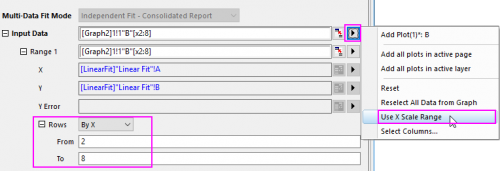
 | Since Origin 2020b, you can customize the X axis scale by zooming or setting the From and To scale values to explore the data, and then open the analysis dialog to select Use X Scale Range as input Range to only analyze the X scale range on the graph.
|
The remainder of this topic discusses how to specify a data range in the Input Data branch of Origin's analysis dialog boxes.
Selecting a column of data from a list
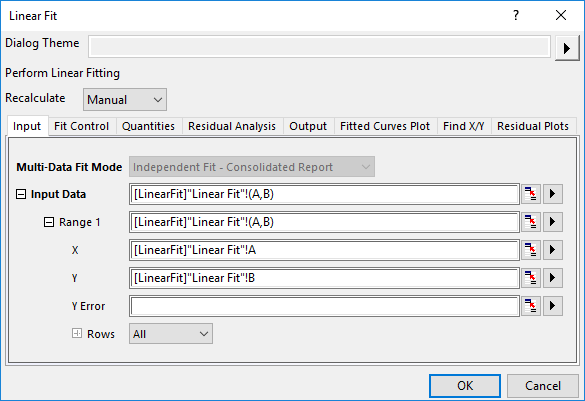
The topmost level of the Input Data branch shows all of the input datasets. You can click the + icon to expand this branch and see the Input Data ranges:
If you click the right-pointing triangle button to the right of the range boxes, you will see (a) a list of columns of data from the active window and (b) menu commands which may be used to specify or modify the input range
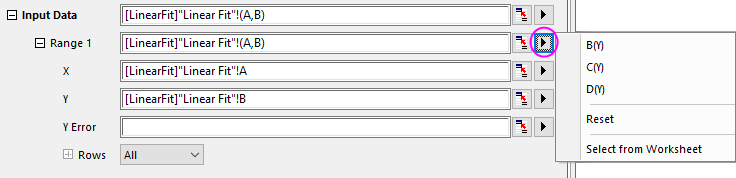
The particular list you see depends upon the active window type when the dialog was launched and which button was clicked. You can use this list control to do the following:
| To do this...
|
Do the following:
|
|
Change input data
|
Select another data column from the list to replace the currently selected column.
|
|
Add data ranges
|
Selecting the Add or Whole Sheet/Add All Columns command from the list will add a new range node(s) to the existing list of ranges. This allows you to add data without closing the tool.
|
|
Reset input
|
Clicking the Reset command on the list will clear all Input Data fields so you can re-enter input data ranges.
|
|
Restrict input range
|
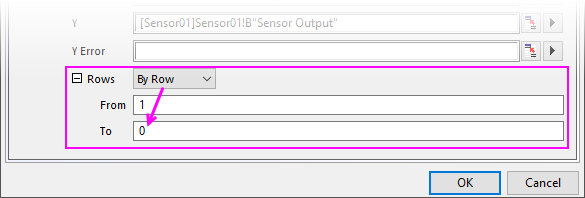
Each Range node has a Rows box that allows you to specify a subset of data rows to analyze (From and To). Typical options are By X (x value) or By Row (row index).
|
|
Select data in graphs
|
If the tool is opened when a graph window is active, a different data list displays. In this case the Input Data branch picks up the active curve, but you can add or substitute other curves from the active layer or page.
You can also choose All Plots, or use Reset to clear all ranges. The Select from Graph option allows you to go out to the graph and then make either single or multiple curve selections using the Data Selector tool.
|
Using the interactive range selection control
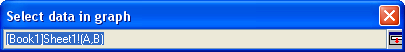
Next to each data range field, there is an Interactive Range Selector button  . When you click this button, the dialog box "rolls up." In roll-up mode, you can go outside the dialog box and select a range of data (either in your worksheet or your graph, depending upon which was active when the tool was opened). . When you click this button, the dialog box "rolls up." In roll-up mode, you can go outside the dialog box and select a range of data (either in your worksheet or your graph, depending upon which was active when the tool was opened).
When you've completed your range selection, you can click the button on the right side of the rolled up dialog box, restoring the analysis tool and registering the selected data range in the associated Input Data node.
For more information on data range selection, see the following topics:
Entering a data range string under the Input Data branch
If you are familiar with the LabTalk range syntax, you can also specify input ranges by typing directly in the edit boxes under Input Data branch. Note that some analyses will act on a single single pair of datasets (e.g. Interpolate/Extrapolate), in which case the syntax would look something like this:
[Waterfall]Waterfall!(A,B)
... to specify column A(X) and B(Y) in workbook Waterfall and worksheet Waterfall.
Other analyses can be performed on many datasets simultaneously (e.g. Batch Peak Analysis Using Theme), in which case the syntax would look something like this:
[MultiplePeaks]"Multiple Peaks"!(A,B:E)
... to specify column A(X) and B(Y) through E(Y) in workbook MultiplePeaks and worksheet Multiple Peaks.
Some analyses do not XY column designations in analysis (e.g. Frequency Counts), in which case the syntax would look something like this:
[MultiplePeaks]"Multiple Peaks"!(2:5)
... to specify columns 2 though 5.
For information on the LabTalk data range notation syntax, see this topic.
| The Input Data text box can seem balky when the worksheet contains many columns of data. In such cases, try typing your your range string into a Notepad window, then copy and paste it to the text box.
|
Selecting Objects with Different Browsers
In different analysis dialogs, you can bring up different object browsers from data input nodes. These browsers list valid analysis objects in the specified path, such as in current workbook, current folder, etc. You can select, add, replace, or remove analysis data from these browsers.
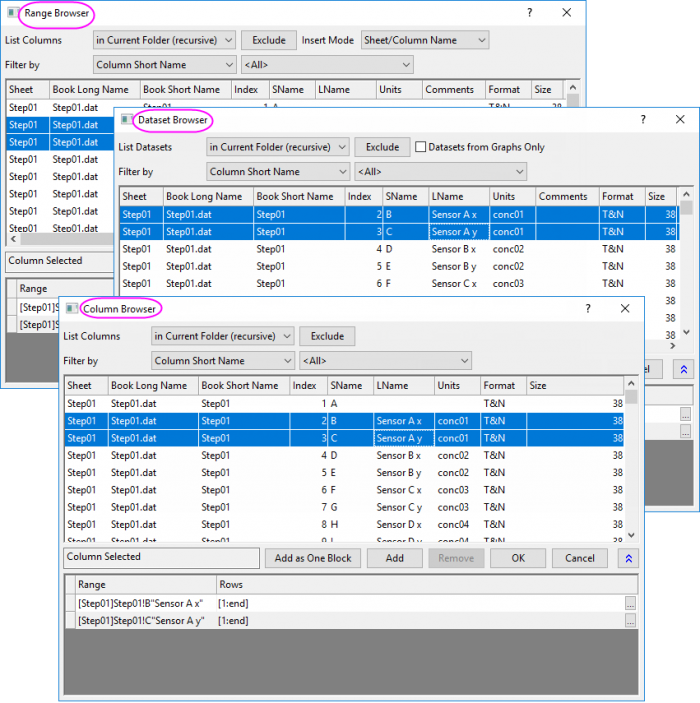
Column/Range/Dataset Browser
In most analysis dialog, you can click the button to the right of the range text boxes, and select Select Columns menu item, or click the  button in e.g. Nonlinear Curve Fit dialog, to open Column Browser . The Dataset Browser,Column Browser or Range Browser dialog are designed similarly. button in e.g. Nonlinear Curve Fit dialog, to open Column Browser . The Dataset Browser,Column Browser or Range Browser dialog are designed similarly.
You can use this dialog to do the following:
| Desired Result:
|
Procedure:
|
|
Browse and list columns in different location
|
Select the proper location from List Columns drop-down list.
|
|
Exclude column(s) in browser
|
When there are too many datasets in the upper browser panel, select the datasets you don't want to see and click the Exclude button.
|
|
Include Hidden Sheet
|
Select Include Hidden Sheet checkbox to show hidden worksheets in the upper browser panel.
|
|
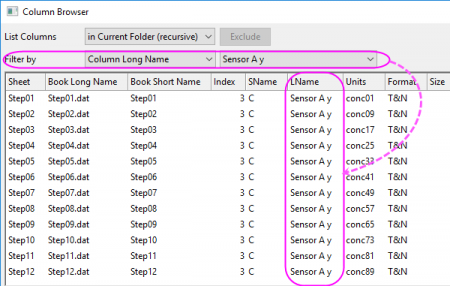
Filter Columns with specified identifier
|
Use Filter by drop-down list to specify the identifier and select the desired value in the following condition drop-down list.
For Example, if you select Column Long Name for Filter by list, and set the condition value to Sensor A y, all columns with long name "Sensor A y" in current location will be listed in the upper panel.
|
|
Sort columns
|
Click the column header on upper panel, like Sheet, Index, and LName, etc to sort datasets. You can do nested sort by holding down SHIFT key before clicking on secondary column headers.
|
|
Add multiple columns as one block
|
Hold Ctrl or Shift key to select multiple columns from upper panel and click Add as One Block button.
|
|
Add column
|
Select column(s) from upper panel and click Add button.
|
|
Remove column
|
Select column(s) from lower panel and click Remove button.
|
|
Select Data from Graphs Only
|
When there are both datasets from worksheets and from graphs in the upper browser panel, you can check Datasets from Graphs Only box to hide datasets from worksheets and show datasets from graphs only.
|
|
Insert Range by Name or Index
|
Available for Range Browser only, which can be opened from the Set Values dialog by selecting Variables: Add Range Variables dialog menu.
Select Insert Mode next to Exclude button to decide how to insert the range, by Name or by Index.
range r1 = [Step01]1!Col(2);  ///By sheet/column index
range r2 = [Step01]Step01!B"Sensor A x"; ///By sheet/column name
|
|
Datasets from Graphs Only
|
Available for Dataset Browser only when a Graph window is active and open Linear Fit dialog or some other analysis tools.
Select checkbox Datasets from Graphs Only next to Exclude button to show datasets from graphs within the selected location.
|
Matrix Browser
In the matrix-related dialogs, such as Expand Matrix and Transpose Matrix dialog, you can click the right-arrow button  to select Matrix Browser to open the Matrix Browser dialog. to select Matrix Browser to open the Matrix Browser dialog.
You can use this dialog to do the following:
| Desired Result:
|
Procedure:
|
|
Browse matrices in different location
|
Select the proper location from List Matrices drop-down list.
|
|
Remove Matrix
|
Select matrix from lower panel and click Remove button.
|
|
Sort columns
|
Click the column header on upper panel, like Sheet, Index, and LName, etc to sort matrices. You can do nested sort by holding down SHIFT key before clicking on secondary column headers.
|
|
Exclude matrix(matrices) in browser
|
When there are too many matrices in the upper browser panel, select the matrices you don't want to see and click the Exclude button.
|
|
Replace the selected matrix
|
When you have selected a matrix and added it into the lower panel, you can select another matrix in the upper panel and click Replace button to replace it.
|
When you select Mat(1):Matrix Browser in the Set Values dialog from a matrix, it will open the Matrix Object Browser to let you select the matrix objects in current matrix window. You can only select one object in the browser and add it to the parent dialog.
Image Browser
In the image processing tools, you can click the right-pointing triangle button to the right of the range box and select Image Browser menu item to open Image Browser.
You can use this dialog to do the following:
| Desired Result:
|
Procedure:
|
|
Browse image in different location
|
Select the proper location from List Images drop-down list.
|
|
Remove Image
|
Select image from lower panel and click Remove button.
|
|
Replace Image
|
Select an image upper and lower panel respectively, and click Replace button.
|
|
Sort Images
|
Click the column titles on upper panel, like Sheet, Index, and LName, etc to sort datasets.
|
|
Exclude images in browser
|
When there are too many images in the upper browser panel, select the images you don't want to see and click Exclude button.
|
Graph Browser
In the Merge Graph or Export Graph dialogs, you can click the button to open Graph Browser dialog, when using the Specified input or output mode.
You can use this dialog to do the following:
| Desired Result:
|
Procedure:
|
|
Add or remove graphs
|
Select graphs on left or right panel and use the  or or  button to add or remove graphs. button to add or remove graphs.
|
Report Tree Browser:
The fit comparison tools (fitcmpdata & fitcmpmodel) use fit results to compare two fits. By clicking the button to bring up the Report Tree Browser, you can specify the fit report worksheets.
You can use this dialog to do the following:
| Desired Result:
|
Procedure:
|
|
Specify report worksheet
|
Double-click to select report worksheet.
|
|
Sort report worksheets
|
Click the column titles, such as Worksheet or Class, to sort worksheets.
|
Sheet Browser
Many tools with worksheets as input, you can open Sheet Browser dialog to specify the sheets to take performance. For example, in the Worksheet: Append Worksheet tool, click the ▶ button and choose Select Worksheet... menu item to open Sheet Browser dialog. Or, you can New a Layout, and select Add Worksheet from the context menu to open the Sheet Browser dialog.
You can use this dialog to do the following:
| Desired Result:
|
Procedure:
|
|
Add a worksheet
|
Select the worksheet on right panel and click OK button.
|
|
Add a worksheet by the shortcut
|
Select the checkbox of Include Shortcut Page, then the shortcut of the workbooks will showed in the left panel. You can choose a worksheet to add.
(How to creating a shortcut).
|
|
Include hidden sheet(s) in the upper list box
|
Check Include Hidden Sheet checkbox to show the hidden worksheets in the specified location.
|
|