12.2.4 Recalculating Analysis ResultsAnalyDialog-Recalculate
All analysis tools and most other data-processing dialog boxes include a Recalculate control, usually located near the top of the dialog box where you specify your input data.
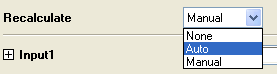
Use this operation-specific control to determine how the software will treat changes to input data. Choose one of three modes -- None, Auto and Manual (see table, below). In summary, None = do not recalculate, Auto = trigger recalculate automatically and Manual = trigger recalculation manually.
Modes for Recalculate
| None
|
If Recalculate is set to None, the output is disconnected from the input data. Subsequent changes to the input data will not result in an update to the original output data. Additionally, it isn't possible to reopen the dialog box using the Change Parameters shortcut menu command (see below) and make adjustments to the analysis parameters (The Set Values dialog box is the one exception).
|
| Auto
|
If Recalculate is set to Auto, the results are automatically updated when the input data changes.
|
| Manual (Default)
|
If Recalculate is set to Manual, you are able to manually trigger an update following changes to the input data.
|
Recalculate Toolbar Buttons and Operation Lock Icons
The presence of recalculating operations in an Origin project produces several visual cues to the user:
- When the project includes output from any graphing or analysis operation for which Recalculate Mode has been set to Manual or Auto, the Recalculate button on the Standard toolbar is turned on.
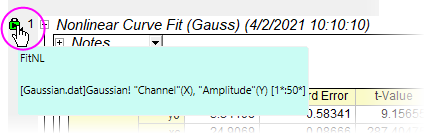
- A "lock" icon (e.g
 ) is added to all output data that is linked by some calculation, to input data. The lock icon signifies to the user this is analysis output and it cannot be manually edited. ) is added to all output data that is linked by some calculation, to input data. The lock icon signifies to the user this is analysis output and it cannot be manually edited.
- Having many recalculation operations in your project file can slow down your work.
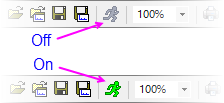
- Pause all recalculation in the session by clicking the Pause Auto Update/Recalculations button
 on the Standard toolbar (hotkey Ctrl + 0 ). on the Standard toolbar (hotkey Ctrl + 0 ).
- You can also suspend recalculation in the session by setting the value of system variable @AU = 0. Note that when you block calculations, the Status Bar displays AU: OFF.
- Block recalculation of individual operations by clicking on the associated lock icon and choosing Block Recalculation from the popup menu.
- For graphs including any recalculations, all locks (e.g ) list at top-left corner of the graph window aligning with corresponding layer icon. You can select menu Data: Lock Position: Layer Icon/First Point/Last Point to change position.
- Note that only the locks for visible plot(s) will be shown in a graph. That is, if a plot is hidden, the lock linked to this plot will be hidden as well.
- Setting Recalculate Mode = None deletes the operation.
- Deleting input to an operation deletes the output.
The following table summarizes the various recalculation buttons and icons and explains their significance.
| Button / Icon
|
Description
|

|
Located on the Standard Toolbar. A green button signals that there are no recalculation operations pending in the project.
|

|
Located on the Standard Toolbar. A yellow button signals that there are manual recalculation operations pending in the project.
|

|
Located on the Standard Toolbar. A dimmed button signals that recalculation operations either do not exist in the project or are blocked in the session (see above).
|
|
|
Located on the Standard and AutoUpdate Toolbars. When clicked, the recalculate button (green or yellow) is dimmed and operations are paused until the button is clicked again.
|

|
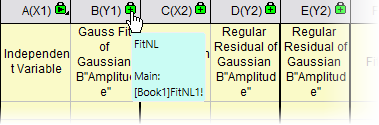
Associated operations are set to Recalculate = Auto. No pending operations. The main operation lock displays on the left-most column as , while any related operations columns to right of the main operation display the "+" icon  . Hovering over the related operation lock pops up tooltip indicating the main operation lock. . Hovering over the related operation lock pops up tooltip indicating the main operation lock.
|

|
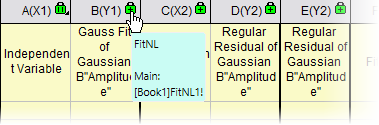
Associated operations are set to Recalculate = Manual. No pending operations. Initially, all Manual recalculations will show as green. Any related up-to-date operations columns to right of the main operation display the "+" icon . Hovering over the related operation lock pops up tooltip indicating the main operation lock.
|

|
Associated operations are set to Recalculate = Manual. When input to up-to-date Manual operations is changed, the icon will change from green to yellow. Any related pending operations columns to right of the main operation display the "+" icon 
|

|
A dark gray lock icon indicates that the associated operation was performed in OriginPro and the window or project has been opened in standard Origin. The operation is not supported by standard Origin and to modify or re-run the analysis, you will need to locate a computer with an OriginPro license.
|

|
A red lock icon signals that something has occurred which prevents further recalculation. Such conditions are rare but would occur if, for instance, you passed a project file that included a user-defined curve fitting operation to a colleague but failed to share your user-defined fitting function.
|

|
Blocking an up-to-date recalculation places this green "block" icon on all operations in the chain.
|

|
Blocking a pending recalculation, or changing input on a blocked up-to-date recalculation operation, places this yellow "block" icon on all operations in the chain.
|
 | If you do not see one of the toolbar buttons described above, you can open the Customize (Toolbars) dialog and add the button(s) to the workspace.
|
Context Menu for Locked Operations
You can click on a lock icon in a graph or report sheet and open a context menu. Listed options are explained in the following table. Menu options will depend on the operation.
| Recalculate Mode
|
Trigger recalculation of the result columns/sheets and update the results. When a lock is green (Auto or Manual), the Recalculate option will be grayed out.
|
| Change Parameters
|
Open the original dialog box to make changes to the settings.
When the worksheet (report sheet) or graph with the recalculate green lock, you also can use hot keys Ctrl + F10 or Ctrl + click green lock icon to reopen the original dialog.
|
| Delete
|
Delete all the output results related to this operation. Results cannot be recovered after deleting.
|
| Go to Source
|
Go to the worksheet containing this operation's input data.
If this operation has multiple source sheets, Origin will go to the first one. If this operation has multiple lock icons, Origin will go to the first source sheet of this operation. (To distinguish overlapped lock icons, change the lock icon position from Layer Icon to First Point or Last Point by choosing Data: Lock Position: First Point/Last Point.)
|
| Go to Graph
|
Go to the source graph containing the input plot. Note: This item is only available when this operation starts from a graph window.
If this operation has multiple source graphs, Origin will go to the first one. If this operation has multiple lock icons, Origin will go to the first source graph of this operation. (To distinguish overlapped lock icons, change the lock icon position from Layer Icon to First Point or Last Point by choosing Data: Lock Position: First Point/Last Point.)
|
| Go to Results
|
Go to the result sheet of this operation. This menu is available only when a Graph window is active.
If this operation has multiple result sheets, Origin will go to the first one. If this operation has multiple lock icons, Origin will go to the first result sheet of this operation.
|
| Analysis Markers
|
Control the display of Analysis Markers in the graph window. Graph window context menu only
|
| Plot Input Data with Data Markers
|
Plot the input data with Data Markers in a new graph window. Worksheet context menu only.
|
| Recalculate mode: Manual/Auto/None
|
The selected mode will show a check mark next to it. Change the mode by selecting another option.
|
| Block Recalculation.
|
Click Block Recalculation to suspend recalculation for this operation and all other operations in the chain. For pending recalculations places a yellow "block" icon on each associated operation in the chain. Placing a block on up-to-date calculations places a green "block" icon on each operation in the chain. To remove the block, click on the "block" icon and clear the check mark (Note that clicking the yellow Recalculate button on the Standard toolbar does not update blocked operations). When recalculation is blocked, the other menu options listed in this table are not available.
|
| Ignore Hidden Rows
|
Select from sub-menu to ignore or include hidden rows (filtered data) during subsequent plotting and analysis operations. Auto means following Ignore Hidden Rows on Plotting and Analysis setting on the Miscellaneous tab of the Worksheet Properties dialog.
Note that Set Column Values tool, Copy Columns to tool, set of nlbegin X-Functionsand operation with matrix as input don't support this menu.
|
| Show Info
|
Write notes and input/output information out to the script window.
|
| Save Theme As
|
Save associated analysis dialog parameters as a Theme that can be used to repeat the same operation on new datasets.
|
| Copy Operation
|
Copy the analysis operation of the current curve to other graphs when performing 2D and 3D fitting analysis except Multiple Linear Regression. To paste the analysis operation, right click the destination plot, grouped plots, layer or whole graph and select the Paste Operation context menu command. Note that Origin does not allow different kinds of data inputs to do paste operation.
More details please click Copy/Paste Operation
This menu is not available for the recalculation on matrix data.
|
| Duplicate this Operation
|
Recalculate is useful for changes to data. Copy Operation is useful for applying an analysis to other graphs. Duplicate this Operation is useful for comparing results after changes to operation parameters. Perform your initial operation, then click the lock and choose Duplicate this Operation. This adds (a) a new operations lock to the graph window or (b) a new set of output sheets to the workbook. Click on a newly-added lock icon and change parameters to update only the duplicate operation. Compare with results from the initial operation.
|
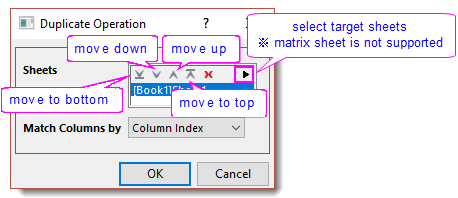
| Duplicate Operation for Special Sheets
|
Apply the current analsysi (with the same parameter settings) to specified worksheets. This menu is ideal for batch-processing multiple sheets in the current project. It opens the Duplicate Operation dialog, where you can choose the target sheets (can include hidden sheets), and how to match columns: by Column Index or Long Name.
|
| Repeat this for All Plots/Y Columns
|
Repeat the analysis of the current plot/Y column for:
- All remaining visible plots on the current graph.
- All remaining Y columns in the source worksheet.
If there are multiple plots in the graph or multiple Y columns in the source sheet, and you have performed analysis on one of them, use this context menu item to perform the same analysis on all other plots/Y columns. For more details, see Repeating Analysis on Other Datasets or Data Plots.
This menu is not available for the recalculation on matrix data.
 | Users should note a change for Origin 2022b: In earlier versions, if the original analysis output created a new sheet or book, Repeat this for All would create a new sheet or book for the remaining Y columns or plots. Users expressed a desire to send all output to a single sheet regardless of the original output specification. If input columns share a common X dataset, the X dataset will be written to the output sheet only once. To roll back to the previous behavior, set @RAO = 0 (default is 1).
|
|
Remove Locked Operations
Sometimes, you will need to remove the lokced operations for post-processing.
- To remove specified locked operation, click on the green lock icon and select Recalculaate Mode: None.
- To batch remove locked opersations in
- activa sheet/(graph) layer
- active (workbook/matrix/graph) window
- active folder (open or recursive, shortcut windows will also be included by default)
- whole project
select menu Edit: Remove Operations for.
Notes:
- If an operation relates to multiple sheets/layers, removing it from the active sheet/layer will remove it for all related sheets/layers.
- The removing action is not recoverable since all operation objects have been removed.
|
|