2.7.69 plotpClamp
Brief Information
Plot pCLAMP data that has been imported to worksheet
Command Line Usage
1. plotpClamp iw:=[Book1]Sheet1;
2. plotpClamp stimulur:=1 septstim:=1;
X-Function Execution Options
Please refer to the page for additional option switches when accessing the x-function from script
Variables
Display
Name
|
Variable
Name
|
I/O
and
Type
|
Default
Value
|
Description
|
| Input Worksheet
|
iw
|
Input
Worksheet
|
<active>
|
Specifies the worksheet which has the imported pClamp data. Note that this variable is hidden in the X-Function panel.
|
| Select File to Plot
|
findex
|
Input
int
|
|
Specifies the index of the pClamp file to plot. Note that this variable is hidden in the X-Function panel.
|
| Show Tags in Graph
|
tag
|
Input
int
|
0
|
Specifies whether to show the tags in the signal graph. This is available only when the imported file has tags.
|
| Plot Stimulus Waveform
|
stimulur
|
Input
int
|
0
|
Specifies whether to plot the stimulus waveform. This is available only when the imported file has stimulus waveform.
|
| Plot Stimulus in Separate Graph
|
septstim
|
Input
int
|
0
|
This variable is only available when the stimulus variable is set to 1. It specifies whether to plot the stimulus waveform in a separate graph.
|
| Pick Value Line
|
pickval
|
Input
int
|
1
|
Specifies whether to add a pick value line to the signal graph.
|
| Axis Scrollbar
|
scrollbar
|
Input
int
|
1
|
Specifies whether to add a horizontal axis scrollbar to the signal graph.
|
| Control Panel
|
ctrl
|
Input
int
|
1
|
Specifies whether to show the control panel in the signal graph.
|
| Display Mode
|
mode
|
Input
int
|
sweeps
|
Specifies the display mode of the signal graph.
Option list
- sweeps:Sweeps
- All episodes are plotted within the time range of the first episode.
- continuous:Continuous
- The episodes are joined according to the start time of each episode. If there is time gap between episodes, the time gap will be perserved.
- concatenated:Concatenated
- The episodes are concatenated without considering the start time of each episode. If there is time gap between episodes, the time gap will be ignored.
|
| Plot Settings
|
trsetting
|
Input
TreeNode
|
<unassigned>
|
Use this control to select the channels and episodes to plot.
|
| Signals Graph
|
plot
|
Output
GraphPage
|
<new>
|
Specifies the signal graph. Note that this variable is hidden in the X-Function panel.
See the syntax here.
|
| Stimulus Waveform Graph
|
waveform
|
Output
GraphPage
|
<optional>
|
Specifies the graph for the stimulus waveform. Note that this variable is hidden in the X-Function panel.
See the syntax here.
|
Description
This X-Function can be used to plot pClamp data that has been imported into Origin worksheet. It is automatically opened in the X-Function panel, when the Show Control Panel for Making Plots checkbox is selected in the imppClamp X-Function dialog.
Pick values line is a special line that can be added to the signal graph. When it is not selected, it appears to be a blue vertical line. When it is selected, it becomes purple. You can move it and click the  button to pick values that correspond to the current X value. The values are written to a workbook named PickedValues. button to pick values that correspond to the current X value. The values are written to a workbook named PickedValues.
Examples
The below example shows you the difference between different display modes.
1. Create a new project.
2. Select Data: Import from File: pClamp (ABF, DAT) from the Origin menu to open the pClamp dialog. Browse to Samples\Import and Export\pCLAMP\ under Origin program folder and select 93310C08.DAT. Make sure that the Show Options Dialog checkbox is selected. Click Open. This should bring us to the imppClamp dialog.
3. Click OK to perform the importing. The plotpClamp X-Function should be rendered in the X-Function panel that is attached to the workbook with imported data.
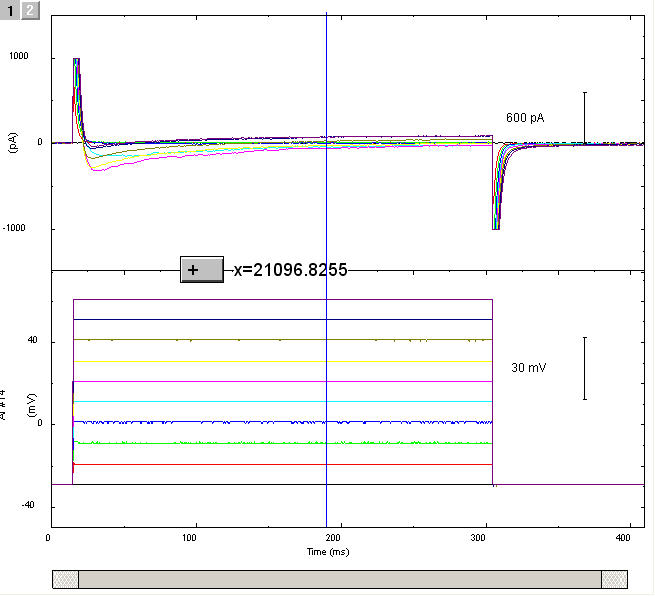
4. Select a Display Mode, and then click the Plot button. A graph should be created for the input data.
If Sweeps is selected for Display Mode:
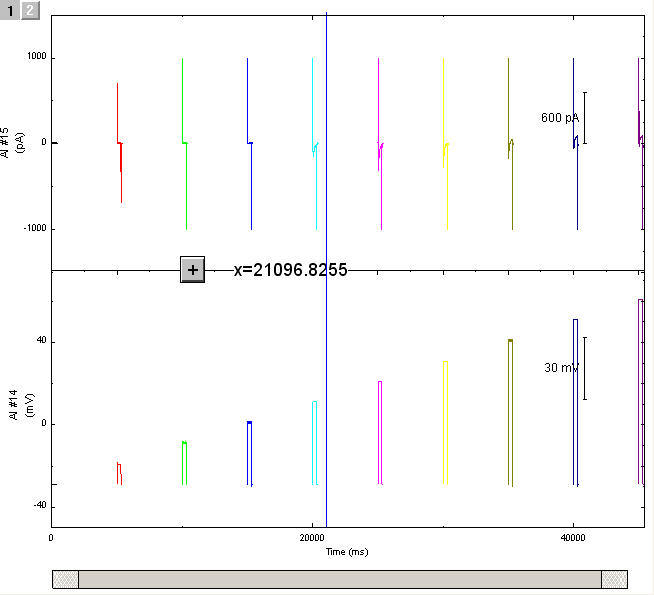
If Continuous is selected for Display Mode:
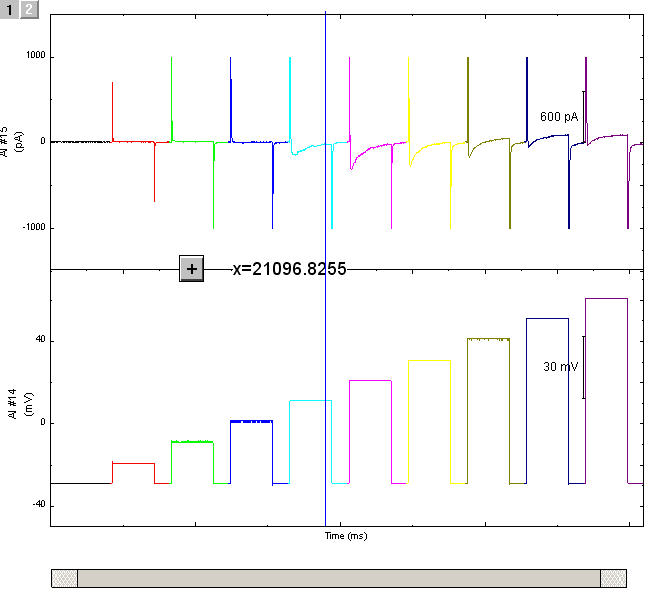
If Concatenated is selected for Display Mode:
Related X-Functions
imppClamp, pclampplotcontrol
|