8.11.3 Creating 3D and Contour Graphs from Virtual MatrixPlot-3D-Contour-VirtMat
What is a Virtual Matrix?
When looking to create a contour plot or 3D surface plot in Origin, there are three basic data arrangements that can be used: XYZ worksheet columns, a matrix of Z values, or what we call a Virtual Matrix. Unlike the regular matrix, the Virtual Matrix supports uneven-spacing of X and Y values as long as they are sorted.
The Virtual Matrix typically starts from a worksheet that is arranged (1) with a row of Y coordinate values along the top of the worksheet and (2) column of X coordinate values in the first column of the worksheet (or vice versa), plus a 2D array of "Z" values in a block defined by the intersections of all X and Y coordinate pairs.
X or Y coordinate values may be in the first row or column of the data portion of the worksheet; they may be stored in the column label row area of the worksheet; or they may be in another portion of the worksheet that you define using, for instance, the interactive X Range or Y Range selection control.
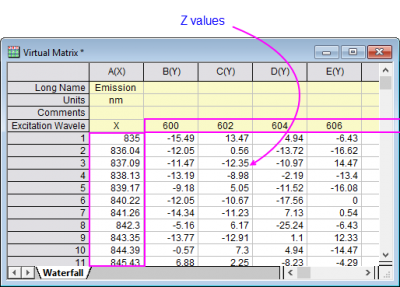
If you have imported data from MS Excel or perhaps have imported an ASCII file that was instrument-generated, and your data arrangement resembles that in the worksheet above, it may be in a form that can be used in creating a Virtual Matrix.
- Data Layout: Y data across columns or X (data across columns).
- X Values/Y Values in 1st row in selection or 1st column in selection, in column label row or by interactive range selection.
Available 3D and Contour Graph Types that can be Created from Virtual Matrices
The following are all the graph types that can be created from a Virtual Matrix.
- 3D Color Fill Surface
- 3D X constant with Base
- 3D Y constant with Base
- 3D Color Map Surface (and Color Map Surface with Projection)
- Gray Scale Map 3D Scatter
- 3D Wire Frame
- 3D Wire Surface
- Matrix 3D Bars
- Contour – Color Fill
- Contour B/W lines
- Heatmap
How to Create 3D and Contour Graphs from a Virtual Matrix
To create contour or 3D plot from a Virtual Matrix:
- Select the worksheet or a range of worksheet cells, then click the Plot menu to select your 3D graph type.
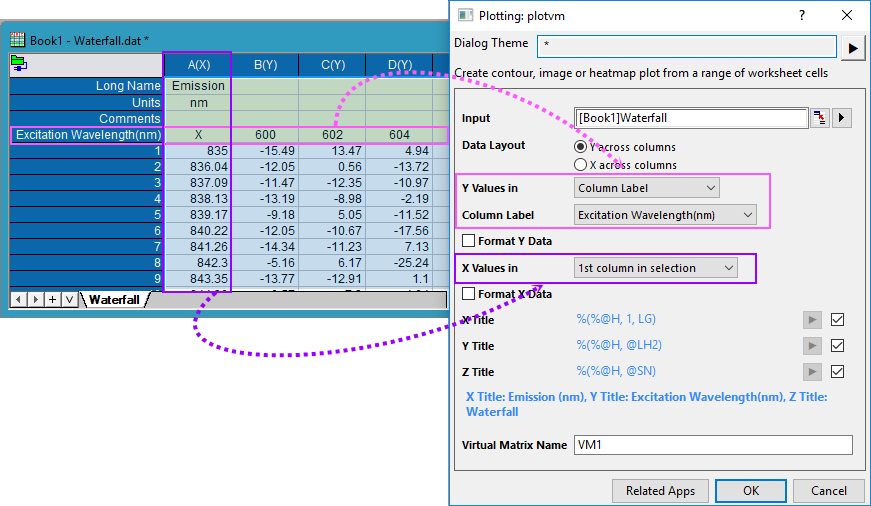
- In the plotvm Dialog that opens, specify how your worksheet data are to be treated when converting to a Virtual Matrix.
Dialog Controls of the plotvm Dialog
| Input
|
Specify the Z-values for plotting a 3D or Contour graph. You can select an existing virtual matrix as input from fly-out menu or Virtual Matrix Manager.
Note: if you select a whole worksheet, the virtual matrix will be dynamic updated when you add or delete columns/rows in the source worksheet. If you select a worksheet cell block from a certain column/row to the end column, for example from 5th column to end, and want the virtual matrix be dynamic updated, right click on the triangle button to the right of Input and select Dynamic Ends.
|
| Data Layout
|
Specify which way to set the X- and Y-values for the graph. Available options include:
- Y across columns
- Use the values in a row as the Y-values and the values in a column as the X-values.
- X across columns
- Use the values in a row as the X-values and the values in a column as the Y-values.
|
| Y Values in / X Values in
|
The two drop-down lists are used to specify the X and Y data range when creating virtual matrix. The sequence of these two changes dynamically depending on the selection of Data Layout, and the upper one is used to specify a row, while the lower one is used to specify a column. The available options are as below:
- None
- Use row index or column index.
- 1st row/column in selection
- Use the values of the first row/column in the current selection.
- 1st row/column in worksheet
- Use the values of the first row/column in the current worksheet.
- Column label
- This is only available when a row is to specified. Uses the values of the column labels in the worksheet. It will allow you to select a column label row from the Column Label drop-down list. Please note that if only a range of the worksheet has been selected as Input data, then this tool will automatically use the corresponding part of the column label values.
- Custom
- Use this option to allow manual selection of data with the X Range (or Y Range) box. Please note the X(or Y)-values can only be selected from the same worksheet.
|
| Format Y Data / Format X Data
|
Specify the data format of the Y/X data as Numeric (default), Text, Time or Date. Select this checkbox and click the ... button on the right of the text box to open the Format Data dialog, and select Format and Display to be applied to the Y/X data.
When Y Values in/X Values in is set to None, this check box will be disabled.
|
| X Title / Y Title / Z Title
|
Specify the axis title for X Y or Z axis, respectively. Uncheck the check box at the end of the control, you can click the arrow button to select the source sheet information as title from the fly-out list.
Selecting any item from the fly-out list will insert the corresponding notaion into the box; the actual titles will be shown under the controls as a blue hint:
- LG: Long Name and Units: Selecting it will insert the notaion %(%@H, 1, LG)
- L: Long Name: Selecting it will insert the notaion %(%@H, 1, L)
- U: Units:Selecting it will insert the notaion %(%@H, 1, U)
- C: Comments:Selecting it will insert the notaion %(%@H, 1, C)
- P1: First Parameter:Selecting it will insert the notaion %(%@H, 1, P1)
- D1: First User Parameter:Selecting it will insert the notaion %(%@H, 1, D1)
- LH1: First User Parameter Name: Selecting it will insert the notaion %(%@H, @LH1)
- SN: Sheet Name: Selecting it will insert the notaion %(%@H, @SN)
- PNL: Book Long Name: Selecting it will insert the notaion %(%@H, @PNL)
- Select from Worksheet: Selecting it will open a dialog to let you click a cell in the worksheet. The notation for selected cell will show. For example, if you select a cell(1st column, 3rd row) in source sheet of VM, the notation is %(%@H, 1, 3); if you select a cell that is not in source sheet, we create %([Book1]Sheet1, 1, 3, W) just like the Insert Variables dialog.
|
| Virtual Matrix Name
|
Specify the short name of virtual matrix object to be created. All virtual matrices created during plotting will be listed and managed in Virtual Matrix Manager.
|
|