16.11 Simple Column/Curve MathMath-SimpleColumnCurveMath
Description
There are two user-interface tools for performing simple math operations on data: mathtool and vmathtool.
| User interface tool
|
Access by
|
Arithmetic operations
|
| mathtool
|
Analysis: Mathematics: Simple Curve Math... (with Worksheet/Graph active)
|
For a curve or XY data range
|
| vmathtool
|
Analysis: Mathematics: Simple Column Math... (with Worksheet active)
|
For a single column
|
Both tools perform arithmetic operations on data in worksheet columns or plotted curves, but the input and operand for the both tools are different.
For vmathtool, the input data is a single column and the operand is a single column or constant, the mathematical operation is performed between the input column and the operand column or constant.
For mathtool, the input data is a XY range (or curve) and the operand is also a XY range (or curve) or constant, the mathematical operation is performed between the input Y column and the reference Y column or constant; There are three cases for X range:
- If X range for input and reference X is identical,operations perform on the corresponding Y range for input and reference directly.
- If X range for input and reference is different , operations perform on the corresponding Y range for input and reference after the XY range interpolation or extrapolation. In addition:
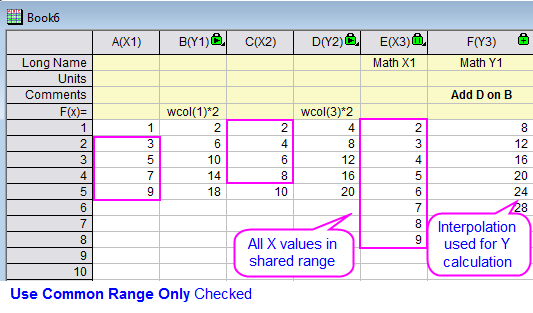
- If the option Use Common Range Only has been checked, the X values in Result is consist of all X values in sharing range, while the corresponding Y values are calculated after interpolation (extrapolation).
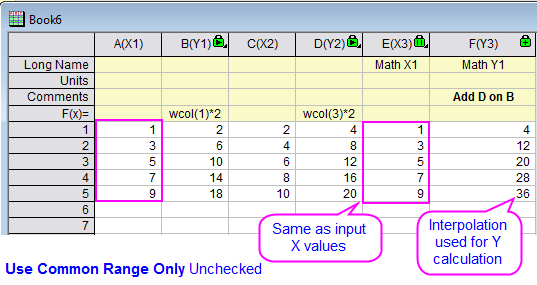
- If the option Use Common Range Only hasn't been checked, the X values in Result is the same as X input, while the corresponding Y values calculated after interpolation (extrapolation) as well.
For detailed information including programming-related information, consult the X-Function Reference: vmathtool and the mathtool
 | Since Origin 2020, you can use simple formula to perform the simple math on columns or curves.
To apply a formula to the input range and a reference data, you need first set Operator to Custom, the Operand will locked to Reference Data, then you can select a reference column and enter a simple formula as below:
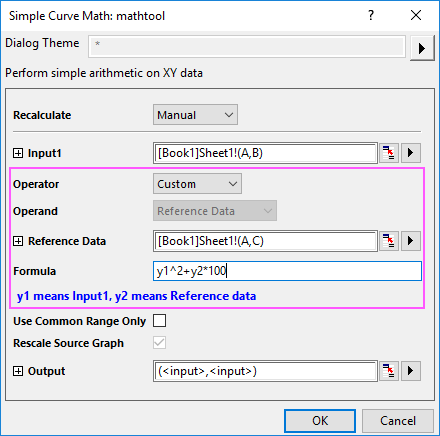
Please note, currently the Formula box only accepts the arithmetic operations with general operators, haven't support LabTalk functions such mean or sqrt.
For the vmathtool tool, x1 means input data and x2 means the reference data.
|
Dialog Options
| Recalculate
|
Controls recalculation of analysis results.
For more information, see: Recalculating Analysis Results
|
| Input
|
Input XY data range or curve.
For help with range controls, see: Specifying Your Input Data
|
| Operator
|
Specify an operator, Add, Subtract, Divide, Multiply or Power.
Since Origin 2020, another optional item Custom is available in this drop-down list, to allow users to enter formula to do the simple mathematics on columns or curves.
|
| Operand
|
- Const
- Use constant as operand.
- Reference Data
- Use reference curve or column as operand.
If the Operator is Custom, this Operand option will be set to Reference Data by default and un-changeably.
|
| Reference Data
|
Specify a curve (XY Range) or column as operand. This option is available when Operand = Reference Data. When two curves' ranges do not coincide, the two curves will be interpolated or extrapolated by linear interpolation, before the specified operation is performed.
|
| Const
|
Specify a constant as operand. This option is available when Operand = Const.
|
| Formula
|
Enter a simple formula with general arithmetic operators to do simple mathematics on the columns and curves. This option is only available when the Operator has been set to Custom.
Please note, currently LabTalk math functions haven't been supported in this formula box. And, for the mathtool tool, y1 means input data and y2 means the reference data; for the vmathtool tool, x1 means input data and x2 means the reference data.
|
| Use Common Range Only (mathtool only)
|
Operate on the common range between the two curves (or XY ranges). This check box is available when Operand = Reference Data.
|
| Rescale Source Graph (mathtool only)
|
Rescale the source graph, as needed, after computations have completed.
|
| Output
|
Specify the output data range.
For help with the range controls, see: Output Results.
|
|