16.10 Average/Merge Multiple CurvesMath-AveCurve
Overview
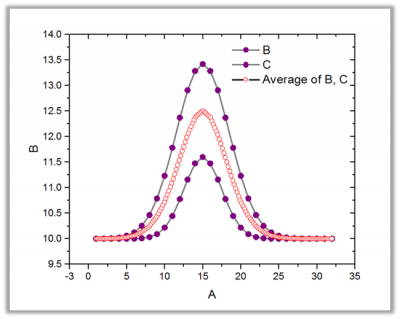
The Average/Merge Multiple Curves tool can average or merge input curves, and output the result as XY Range. If the Method is set to Merge, the input curves will be merged to create a new curve. If the Method is set to Average, the input curves will be averaged to create a new curve. Other additional outputs such as standard deviations, standard errors, and number of points can be also outputted when the Method is set to Average.
To Use Average Multiple Curves Tool
- Create a new worksheet with input data.
- Activate the worksheet.
- Select Analysis: Mathematics: Average/Merge Multiple Curves from the Origin menu to open the avecurves dialog box.
- Choose options and click OK. The X-Function avecurves is called to perform the computation.
Dialog Options
| Recalculate
|
Controls recalculation of analysis results
For more information, see: Recalculating Analysis Results
|
| Input
|
Specifies multiple curves to be averaged or merged.
For help with range controls, see: Specifying Your Input Data
|
| Method
|
Specifies the average method.
- Average
- Average the input curves.
- Merge
- Merges the input curves.
|
| Averaged X
|
Available only when Method = Average. Determines how X values will be computed for the averaged curve.
- Same as Source X
- For each unique X in all datasets, all Y datasets that have values at that X are averaged. X values within Tolerance for Common X Values limit (see below) will be treated as the same point and averaged.
- Common X Range
- Create a set of “Number of Points” of equally spaced X values from the largest minimum X to the smallest maximum X and calculate an average of all interpolated Y. Use the Interpolate list (see below) to control interpolation method.
- Full X Range
- Create a set of “Number of Points” of equally spaced X values from the smallest minimum X to the largest maximum X and calculate an average of all interpolated Y. Use the Interpolate list (see below) to control interpolation method.
- Custom
- Create a set of “Number of Points” of equally spaced X values where you define the minimum and maximum X and calculate an average of all interpolated Y. Use the Interpolate list (see below) to control interpolation method.
- Follow Curve Trace
- Create a set of “Number of Points” of trace interpolated X values and calculate an average of all interpolated Y. Use the Interpolate list to control interpolation method. This method is used with cyclic or periodic data.
|
| Tolerance for Common X Values
|
Available only when Same as Source X is selected for Averaged X. Values of X within the tolerance, will be averaged.
|
| Number of Points
|
It is available when Averaged X is not set to Same as Source X. It specifies the number of points of the interpolated curves. It computes a number automatically if the nearby Auto checkbox is enabled. You can also disable the Auto checkbox and specify the values by yourself.
|
| X Minimun
|
Editable only when Custom is selected for Averaged X (read-only for Common X Range, Full X Range). Specifies the minimum X value of the averaged curve. Computes a number automatically if the Auto check box is selected. Alternately, clear the Auto check box and enter a value.
|
| X Maximum
|
Editable only when Custom is selected for Averaged X (read-only for Common X Range, Full X Range). Specifies the maximum X value of the averaged curve. Computes a number automatically if the Auto check box is selected. Alternately, clear the Auto check box and enter a value.
|
| Interpolate
|
Available only when Averaged X is not set to Same as Source X. Determines how to interpolate the X values before the averaging the input curves.
- Linear
- Perform linear interpolation on the X values.
- Spline
- Perform spline interpolation on the X values.
- B-Spline
- Perform B-Spline interpolation on the X values.
|
| No Extrapolation
|
Available only when Averaged X is not set to Full X Range, Custom, and Follow Curve Trace. Determines whether to extrapolate the curves when the input curves have different X ranges.
|
| Sort X
|
Available only when Method = Merge. Determines how to sort the X values of the averaged curve. Y values will be reordered accordingly.
- None
- Do not sort the X values.
- Ascending
- Sort the X values from smallest to largest.
- Descending
- Sort the X values from largest to smallest.
|
| Additional Output
|
These options are only available when Method = Average.
- Std Dev
- Compute the standard deviation of the averaged curve.
- Std Err
- Compute the standard error of the averaged curve.
- N
- Compute the counts of input data points that correspond to each averaged X value.
- Minimum
- Output the minimum value.
- Maximum
- Output the maximum value.
- SD times 2
- Compute the standard deviation times 2.
- SD times 3
- Compute the standard deviation times 3.
|
| Output
|
Determine where to output results. The Long Name and Unit of input plots will be carried over if all the plots share the same.
For help with the range controls, see: Output Results
|
Algorithm
When the Method variable is set to Merge, all the input ranges are simply joined together and the data points from every input curve are merged one by one.
When the Method variable is set to Average, the X and Y values of the averaged curve are computed. This X-Function supports five methods to compute the X values of the averaged curve.
Same as Source X: The simplest way to compute X values is to specify a tolerance and then treat two X values, X1 and X2, as the same and averaging them if  . The corresponding Y values will not be averaged. The resulting X are sorted in ascending order. . The corresponding Y values will not be averaged. The resulting X are sorted in ascending order.
Common X Range, Full X Range and Custom: These three methods compute the X values of the averaged curve by performing linear, spline or B-spline interpolation on X range input. The first step is to determine what range of X values should be interpolated. Origin interpolates the input curves individually to establish a common set of X values. The corresponding Y values are then obtained by averaging Y values at each X.
Follow Curve Trace: This method uses trace interpolation to compute the XY values. This method is useful for interpolating periodic or cyclic data and can create a new curve whose shape is similar to that of the input curves.
|