8.13.2.1 Add TabLayManage-AddTab
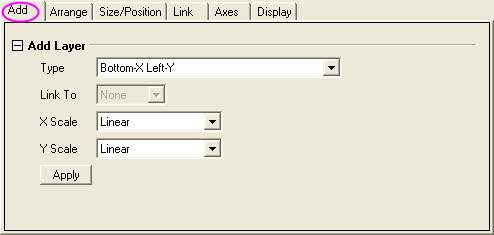
Add Layer
| Type
|
This drop-down list specifies the layer type to be added. Options are:
- Bottom-X Left-Y
- Add a layer with independent bottom X and left Y to the graph.
- Top-X (Linked Y Scale and Dimension)
- Add a layer, which is linked to the Y scale and dimension of the parent layer, to the graph with independent top X axis display.
- Right-Y (Linked X Scale and Dimension)
- Add a layer, which is linked to the X scale and dimension of the parent layer, to the graph with independent right Y axis display.
- Left-Y (Linked X Scale and Dimension)
- Add a layer, which is linked to the X scale and dimension of the parent layer, to the graph with independent left Y axis display.
- Top-X Right-Y (Linked Dimension)
- Add a layer, which is linked to the dimension of the parent layer, to the graph with independent top X axis and right Y axis display.
- Bottom-X Right-Y (Linked Dimension)
- Add a layer, which is linked to the dimension of the parent layer, to the graph with independent bottom X axis and right Y axis display.
- Inset (Linked Dimension)
- Add a inset layer, which is linked to the dimension of the parent layer, to the graph with independent bottom X axis and left Y axis display.
- Inset With Data (Linked Dimension)
- Add a inset layer, which is linked to the dimension of the parent layer, to the graph with independent bottom X axis and left Y axis display. The added layer will display all the plots that are included in the parent layer.
- No Axes (Linked XY Scale and Dimension)
- Add a layer, which is linked to the XY scale and dimension of the parent layer, to the graph with no axes display.
|
| Link To
|
This drop-down list is only enabled when the Type of the layer to be added is not Bottom-X Left-Y. It determines which existing layer will be linked to the new layer.
|
| X Scale
|
This drop-down list can be used to select an X scale type. Options are:
- Linear
- Standard linear scale, where X'=X.
- Log10
- Base 10 logarithmic scale, where X'=log(X).
- Probability
- Represents the inverse of a cumulative Gaussian distribution: X'=norminv(X/100). Plotting a cumulative Gaussian distribution produces a sigmoidally-shaped curve. This curve, when displayed on a probability scale, appears as a straight line. Since probabilities are expressed as percentages, all values must fall between 0 and 100. The probability scale range is 0.0001 to 99.999.
- Probit
- Like the probability scale, a sigmoidally-shaped curve plots as a straight line. In this case, however, the scale is linear, and the increment between tick marks is exactly one standard deviation. The value "5" on the scale shows the mean, or 50% probability. "6" is one standard deviation away, etc.
- Reciprocal
- Reciprocal scale, where X'=1/X.
- Offset Reciprocal
- Offset reciprocal scale, where X'=1/(X+offset). Offset is defined as 273.14, where 273.14 is the absolute temperature for 0° C.
- Logit
- Logit=ln(Y/(100-Y)). As with the probability and probit scales, a sigmoidally shaped curve plots as a straight line.
- Natural Log
- ln, base e logarithmic scale.
- Log2
- Base 10 logarithmic scale.
|
| Y Scale
|
This drop-down list can be used to change the Y scale type. The options in this drop-down list are the same as the ones in the X Scale drop-down list.
|
| Apply
|
When this button is clicked, the Add settings that you changed will be applied in preview graphs, and you can see it in the Preview panel.
|
|