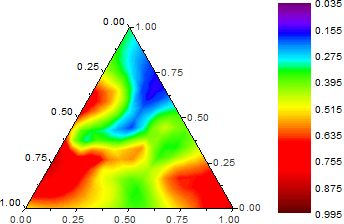
29.18.12 Ternary ContourTernary-Contour
Data Requirements
Select columns designated as "XYZZ" with exact number of columns (or a range from columns designated as "XYZZ" with exact number of columns).
Creating the Graph
Select required data.
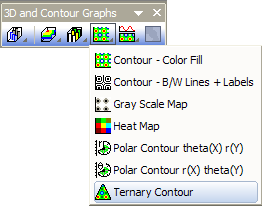
From the menu, choose .
or
Click the Ternary Contour button on the 3D and Contour Graphs toolbar.
Template
TERNARYCONTOUR.OTP (installed to the Origin program folder).
Customize the Graph
From Origin 9.0, it is possible to change the axis directions of ternary contour plot, please refer to this for details.
Beginning with Origin 2021, you can control the Rescale mode of the graph axes:
- Double click on an axis to open the Axis dialog for ternary diagrams.
- Click the Scale tab and set Rescale mode.
Notes
Ternary plots assume that the input data is normalized, which means that the sum of the absolute values of cells in every row equals 1 or 100: |x|+|y|+|z|=1 or 100. If the input data has at least one data point that is not normalized, a Reminder Message dialog box will be shown to ask you whether to normalize your data before the ternary plot is created.
If you choose “Yes”, Origin will normalize the input data and replace the original data with the normalized data in the worksheet. And if you choose “No”, Origin will also normalize the input data and then plot, but the original data in the worksheet will not be changed. When you use the Data Reader (Click the Data Reader button on the Tools toolbar) to read data from the ternary plot, you will read the non-normalized data.
Normalization method is the same as in the ternary plot. Please read this to see the details.
The scales can be changed to display non-triangular regions.
As with other contour plots, you can extract contour line data by right-clicking on selected contour lines and choosing Extract Contour Lines. See this topic for details.
|