29.13.19 TernaryTernary-Graph
Data Requirements
Select one Z column (or a range from one Z column). If this Z column has an associated X and an associated Y column, then these X and Y columns are used; otherwise, the worksheet's default X and Y values are used.
Creating the Graph
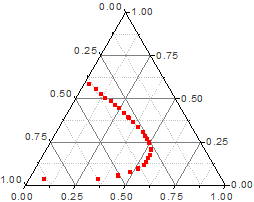
Ternary
- Select required data.
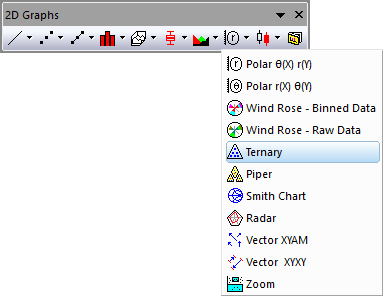
- From the menu, choose .
- or
- Click the Ternary button on the 2D Graphs toolbar.
Line + Symbol Ternary and Line Ternary
- Select required data.
- From the menu, choose .
Template
TERNARY.OTP (installed to the Origin program folder).
Customize the Graph
From Origin 9.0, it is possible to change the axis direction of ternary plot. To do this, you need to:
- Double click on the graph layer to bring up the Plot Details-Layer Properties dialog.
- Go to the Ternary tab, and choose either the Counter Clockwise or Clockwise radio button to set the axis direction.
Beginning with Origin 2021, you can control the Rescale mode of the graph axes:
- Double click on an axis to open the Axis dialog for ternary diagrams.
- Click the Scale tab and set Rescale mode.
Notes
Ternary plots assume that the input data is normalized, which means that the sum of the absolute values of cells in every row equals to 1 or 100: |x|+|y|+|z|=1 or 100. If the input data has at least one data point that is not normalized, a Reminder Message dialog box will come up to ask you whether to normalize your data before the ternary plot is created.
If you choose “Yes”, Origin will normalize the input data and replace the original data with the normalized data in the worksheet. And if you choose “No”, Origin will also normalize the input data and then plot, but the original data in the worksheet will not be changed. When you use Data Reader to read data from the ternary plot, you will read the data that is not normalized.
The normalization is performed with the following steps for each row:
- Sum the absolute values of the cells in the row:
 - If there are more cases of sum>=50 than the cases of sum<50, the input data will be normalized as 0 to 100, otherwise, it will be normalized as 0 to 1.
- Each cell value of this row will be divided by the sum calculated from the last step.
- If the data is normalized as 0 to 100, the normalized value will be displayed as percentage value additionally. For both normalization, Origin will use them correspondingly in tick labels.
You can zoom in on the scales and change them.
|