15.2.1 The Linear Regression Dialog BoxLR-Dialog
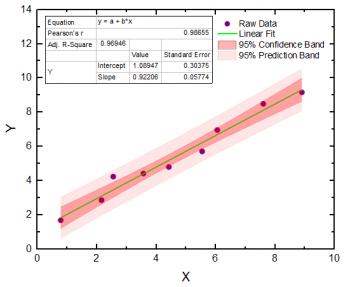
The Linear Regression dialog can be used to fit the simple linear model to your data:
y = β0 + β1x
where β0 is the intercept and β1 is the slope.
Supporting Information
Origin's linear regression dialog box can be opened from an active worksheet or graph. From the menu:
- Click Analysis: Fitting: Linear Fit (Open Dialog...).
See Also:
Recalculate
Input
Multi-Data Fit Mode
| Multi-Data Fit Mode
|
This control is available only when there is more than one input dataset.
- Independent-Consolidated Report
- The input datasets are fitted separately. The reports are consolidated into one sheet.
- Independent-Separate Report
- The input datasets are fitted separately. The reports are output to different worksheets.
- Concatenate
- All input datasets are concatenated and fitted as one curve.
|
Input Data
| Range
|
Specify the input XY data range
X
- X column of the curve.
Y
- Y column of the curve.
Error
- The Y error column.
Rows
- Specify a range of the X column to be fitted. When Rows is set to By Row or By X, you can use the From and To text boxes to specify the range to be fitted.
-
- Fit all rows of the dataset.
- Specify the range of the X column by row index. Use To = 0 to specify "the last row" in the input data range.
- Specify the range of the X column by X value. The By X option supports use of a named range in place of actual X values. For more information, see this OriginLab blog post.
- When fitting multiple XY datasets from a worksheet or a graph, you can use the Apply Row Range to All menu item to apply the same X row range to all input data. Specify a row range for the input column for Range 1, click the
 button to the right of Range 1, then click Apply Row Range to All. button to the right of Range 1, then click Apply Row Range to All.
For more information, see: Specifying Your Input Data
|
Fit Control
| Errors as Weight
|
Use error bars as value for weights. Only available when a designated Error column is selected.
- Do not use any data as weighting.
 = values form the ith row of Error column and = values form the ith row of Error column and^2")
 - where
 = values form the ith row of Error column and = values form the ith row of Error column and
^2")
For more information, see: Weighted Fitting
|
| Fix Intercept
|
Restrict the intercept to the value specified.
|
| Fix Intercept at
|
Specify the intercept.
|
| Fix Slope
|
Restrict the slope to the value specified.
|
| Fix Slope at
|
Specify the slope.
|
| Scale Error with sqrt(Reduced Chi-Sqr)
|
Available when fitting with weight. This check box only affects the error on the parameters reported from the fitting process, and does not affect the fitting process or the data in any way. By default, it is checked, and the covariance matrix is calculated by: ^{-1}") , otherwise, , otherwise, ^{-1}\,\!") . .
When it is checked, it uses reduced Chi-Sqr to estimate error variance, and parameter's standard error is scaled by it, otherwise error variance is specified with 1, and parameter's standard error is not scaled.
 | This option is checked by default to keep parameter's standard error and related results compatible with other software. It is recommended to uncheck this option when fitting data with instrumental weight, so that parameter's standard error can reflect the magnitude of weight.
|
|
| Apparent Fit
|
Use the apparent values for fitting, according to the current axis scales. For example, select this box to fit exponentially decaying data with a straight line fit when data are plotted on a log scale. When this check box is selected and the data has error values associated with it, Origin uses the larger of the positive/negative errors as weight.
|
| Invalid Weight Data Treatment
|
- If there is invalid value in weight data, Origin will throw an error.
- Replace with Custom Value
- Replace the Invalid Weight data with Custom Value
|
| Custom Weight
|
Set the value of Custom Weight. This option is available when Replace with Custom Value is selected.
|
 | Apparent Fit is useful when you are performing a fit on data in an active graph window and you have changed the plot axis type (e.g. from Linear to Log10). When you select this option, the fitter will first transform your raw data into a new data space as specified by the graph axis type, and then fit the curve of the new data. Otherwise, Origin always fits raw data directly, regardless of the axis type. An apparent fit is equivalent to a direct fit performed on transformed raw worksheet data. All items in Residual Analysis are available for Apparent Fit. Outliers identification is also supported in Apparent Fit.
|
Quantities
| Fit Parameters
|
Value
- Parameters' value.
Standard Error
- Standard error of parameters .
LCL
- The lower confidence limit.
UCL
- The upper confidence limit.
Confidence Level for Parameters (%)
- The confidence level for regression.
t-Value
- t-test value of parameters.
prob>|t|
- p-value of parameters.
CI Half-Width
- Half-width of the confidence interval.
For more information, see: Parameters
|
| Fit Statistics
|
Number of Points
- Total number of fitting points.
Degrees of Freedom
- Model degrees of freedom.
Reduced Chi-Sqr
- The Reduced Chi-square value (equal to the residual sum of square divided by the degrees of freedom).
R Value
- The
 value (equal to to square root of value (equal to to square root of  ). ).
Residual Sum of Squares
- Residual sum of squares (RSS); or sum of square error.
Pearson's r
- Pearson correlation coefficient.
R-Square (COD)
- Coefficient of determination.
Adj. R-Square
- Adjusted coefficient of determination.
Root-MSE (SD)
- Residual standard deviation; or square root of mean square error.
Norm of Residuals
- Norm of residuals; equals to square root of RSS.
For more information, see Statistics
|
| Fit Summary
|
Output the fit summary table. This table organizes fit parameters by row for each curve (dependent data).
|
| ANOVA
|
Output the analysis of variance table.
For more information, see: ANOVA Table
|
| Lack of Fit Test
|
Output the Lack of Fit results for fitting replicate data, which is used to measure the adequacy of the specified model.
For more information, see: Lack of Fit Table
|
| Covariance matrix
|
Output the covariance matrix.
For more information, see: Covariance and Correlation Matrix
|
| Correlation matrix
|
Output the correlation matrix.
For more information, see: Covariance and Correlation Matrix
|
| Outliers
|
Output outliers list.
|
| X Intercept
|
Intercept of the fitted curve with line Y = 0.
|
Residual Analysis
Select methods to calculate and output residuals. For more information, see Graphical Residual Analysis
| Regular
|
Output the regular residuals.
|
| Standardized
|
Output the standardized residuals.
|
| Studentized
|
Output the studentized (internally studentized ) residuals.
|
| Studentized Deleted
|
Output studentized deleted (externally studentized) residuals.
|
Output
| Graph
|
Results Table
- Specify whether to show the fitting results to the source/report graph.
-
- No not add fitting result table to the graph.
- Add fitting result table to the source graph. Make sense only when the input data is from graph.
- Add fitting result table to the embedded graphs in the report sheet. When there are more than one graphs in the report sheet, the table will be added to the first one.
- Add fitting result table to both the source graph and report sheet graph.
- Table Style Template
- Specify the Table Style Template used in the results graph.
- Quantities in Table
- Specify the quantities to display in table
- Custom Display for Error Value Table
- Specify the decimal digits for Error value in the result table on the graph
Arrange Graphs into Columns
- Specify a number l. In any result sheet table, graphs will be arranged in rows of l graphs.
Arrange Plots of Same Type in One Graph
- If this check box is selected, plots of the same type will be arranged in one graph.
Arrange Residual Plots in One Graph
- If this check box is selected, all residual plots will be arranged in one graph.
|
| Fitted Results Sheet Arrangement
|
This drop-down list is only available when multiple datasets are input. Specify how to arrange the fitted result worksheets.
- Combined
- All results are combined in a worksheet.
- Separate
- The results are output to separate worksheets.
|
| Dataset Identifier
|
Specify how to label the source data in your output.
- Identifier
- Use the following to identify the source data. Note that when doing a linear fit on plotted data (i.e. a graph window is active) there is an extra Plot Legend option.
-
- Refer to the source data using range syntax.
- Use the workbook long name if it exists (even if not shown) otherwise use book short name.
- Use the worksheet short name.
- Use the displayed sheet name.
- Use the column long name if it exists, otherwise use the column short name.
- Use the column short name.
- Use the column long name.
- Use the column units.
- Use the column comment.
- Available when the active window is a graph window. Uses the legend label for the plot being fitted.
- Use custom notation to identify source data. This option adds a Custom Identifier box for entering your identifier. For help with identifier notation, please refer to these topics:
- Designation
- Specify using the X dataset, Y dataset etc. to provide the Identifier. Choosing <auto> uses the dependent variable (typically, the Y column). This control is not available for all identifiers.
- Show Identifier in Flat Sheet
- Many Origin analysis operations output data to a "flat" sheet in addition to the collapsible analysis report sheets. Use the Identifier in the flat sheet.
|
| Report Tables
|
Specifies the destination of report tables.
- Book
- Specify the destination workbook.
- Do not output report worksheet tables.
- The workbook that is automatically picked by the program.
- The source data workbook.
- A new workbook.
- A specified existing workbook.
- BookName
- The name of the destination workbook.
- Sheet
- The destination worksheet, always <new>.
- SheetName
- The desired name of the destination worksheet.
- Result Log
- Specify whether to output the report to Result Log.
- Script Window
- Specify whether to output the report to Script Window.
- Notes Window
- Specify the destination Notes Window:
- Do not output to any Notes window.
- Output to a new Notes window. You can enter the desired name of the Note window here.
|
| Fitted Curves
|
Specifies the destination workbooks and worksheet for the fitted values.
- Book
- Specify the destination workbook.
- The workbook that is automatically picked by the program.
- The source data workbook.
- The workbook containing the report tables.
- A new workbook.
- A specified existing workbook.
- BookName
- The name of the destination workbook.
- Sheet
- Specify the destination worksheet.
- Source data worksheet.
- A new worksheet
- A specified existing worksheet.
- SheetName
- The name of the destination worksheet.
|
| Fit Residuals
|
- Book
- Specify the destination workbook.
- The workbook has the fitted values.
- The source data workbook.
- A new workbook.
- A specified existing workbook.
- BookName
- The name of the destination workbook.
- Sheet
- Specify the destination worksheet.
- The worksheet has the fitted values.
- A new worksheet.
- A specified existing worksheet.
- SheetName
- The name of the destination worksheet.
|
| Find Specific X/Y Tables
|
Specify the destination of Find Specific X/Y tables. This branch is only available when either the Find X from Y check box or the Find Y from X check box is selected.
- See: Find Specific X/Y, below.
- Book
- Specify the destination workbook.
- The workbook has the fitted values.
- The workbook has the source data.
- A new workbook.
- A specified existing workbook.
- BookName
- The name of the destination workbook.
- Sheet
- Specify the destination worksheet.
- The worksheet that has the fitted values.
- A new worksheet.
- A specified existing worksheet.
- FindX SheetName
- The name of the destination Find X worksheet.
- FindY SheetName
- The name of the destination Find Y worksheet.
|
| Optional Report Tables
|
Specifies what is output to report worksheet.
- Equation in Notes
- Specify the format of the equation on the report table.
- Output the equation with parameter names.
- Output the equation with the fitted values of parameter.
- Notes
- Notes table.
- Input Data
- Table for input data.
- Masked Data
- Table for masked data.
- Missing Data
- Table for missing data.
|
Fitted Curves Plot
| Plot in Report Table
|
When the checkbox is selected, fitted curves will be added to Report Table.
|
| Plot on Source Graph
|
This option is available only when the input datasets are from a graph. It can be used to specify whether to add the fitted curve to the original graph.
- The fitted curve is not added to the original graph.
- The fitted curve is added to the original graph.
- The fitted curve and the plot specified by the Plot Type drop-down list are added to the original graph.
- This option is available only when the input datasets are from a graph and the Concatenate Fit mode is chosen.
|
| Stack with Residual vs. Independents Plot
|
Stack the fitted curve with the Residual vs. Independents Plot.
|
| Update Legend on Source Graph
|
Specify whether to update legend on the source graph.
|
| Multiple Plots Use Source Graph Color
|
Specify whether to use color settings of source graph to color multiple fitted curves.
|
| X Data Type
|
Specify how to generate the X values of the fitted curve.
- The X values of the fitted curve are plotted on an equally-spaced linear scale.
- The X values of the fitted curve are plotted on a logarithmic scale.
- The X values of the fitted curve are the same as the input X values.
- Use Source Graph Scale Type
- The X values of the fitted curve are plotted using the scale type of the source graph.
- This option is available only when the input datasets are from a graph.
- Points
- This control is available only when X Data Type is either Uniform Linear or Log. It specifies the total number of data points in a fitted curve.
- Range
- This control is available only when X Data Type is either Uniform Linear or Log. It specifies the range of the X values of the fitted curve. Select one of the following options:
- Use Input Data Range + Margin
- Use Input Data Range + X Intercept + Margin
- Span to Full Axis Range
- Custom
- Range Margin
- This control is available only when X Data Type is either Uniform Linear or Log and Use Input Data Range + Range Margin is selected for Range. It specifies the range margin into which the fitted curves extend.
- Min/Max
- This control is available only when X Data Type is either Uniform Linear or Log and Custom is selected for Range. These two text boxes specify the minimum and maximum X value for fitted curves.
|
| Confidence Bands
|
If this is checked, confidence bands will be added to the fitted curve plot as two lines with filled area in between. You can turn the area fill off or customize the fill pattern on the Line tab of Plot Details dialog.
For more information, see Confidence and Prediction Bands
|
| Prediction Bands
|
If this is checked, prediction bands will be added to the fitted curve plot as two lines with filled area in between. You can turn the area fill off or customize the fill pattern on the Line tab of Plot Details dialog.
For more information, see Confidence and Prediction Bands
|
| Confidence Level for Curves (%)
|
Specify the confidence level for confidence bands and prediction bands.
|
| Ellipse
|
Check this check box to add the confidence ellipse to the fitted curve plot based on the chosen confidence level.
- Data Points
- Specify the number of data points of the ellipse.
- Mean
- Check this check box to add the confidence ellipse for the population mean.
- Confidence Level (%)
- Specify the confidence level for the confidence ellipse.
- Prediction
- Check this check box to add the confidence ellipse for prediction.
- Confidence Level (%)
- Specify the confidence level for the confidence ellipse.
For more information, see: Confidence Ellipses.
|
Find X/Y
A Find Y from X table is used to obtain a dependent variable value that corresponds to a given independent variable value. A Find X from Y table is used to obtain an independent variable value for a given dependent variable value.
For more information, see: Finding Y/X from X/Y Standard Curves
| Find X From Y
|
Generate a Find X From Y table.
- Calculate 95% Confidence Interval
- Calculate and output the 95% Confidence Interval. Note if the weighting is specified, or there is a fixed parameter, the confidence interval will not be calculated.
|
| Find Y From X
|
Generate a Find Y From X table.
- Calculate 95% Confidence Interval
- Calculate and output the 95% Confidence Interval.
|
|
Note: If you choose Apparent Fit, the Find X From Y and Find Y from X tables will find values on the transformed scale.
|
Residual Plots
Use the controls in this branch to customize the residual plots. For more information, see Graphical Residual Analysis
| Residual Plots
|
Use the controls in this branch to customize the residual plots.
- Residual Type
- Specify the residual type from the drop-down list:
- Regular
- Standardized
- Studentized
- Studentized Deleted
For the selected residual type, you can opt to output up to six residual plots:
- Residual vs. Independents Plot
- Histogram of the Residual Plot
- Residual vs. Predicted Values Plot
- Residual vs. the Order of the Data Plot
- Residual Lag Plot
- Normal Probability Plot of Residuals
|
|