2.2.1.12 XYZ2Mat
Menu Information
Worksheet: Convert to Matrix: XYZ Gridding
Brief Information
Convert XYZ data to matrix
Command Line Usage
1. XYZ2Mat iz:=(col(a),col(b),col(c)) settings.ConvertToMatrix:=1 om:=<new: Sparse>;
2. XYZ2Mat -r 2 iz:=[Book1]Sheet1!((A"x position",B"y position",C:F)) settings.ConvertToMatrix:=2;
X-Function Execution Options
Please refer to the page for additional option switches when accessing the x-function from script
Variables
Display
Name
|
Variable
Name
|
I/O
and
Type
|
Default
Value
|
Description
|
| Input
|
iz
|
Input
XYZRange
|
<active>
|
XYZ worksheet data which needs to convert into matrix by gridding. If multiple Z columns are specified, each Z column will be converted to a matrix object of the same matrix sheet.
|
| Gridding Settings
|
settings
|
Input
TreeNode
|
<unassigned>
|
Settings for gridding XYZ worksheet data. Please refer to More Information section below for more details.
|
| Output Matrix
|
om
|
Output
MatrixLayer
|
<new>
|
If this check-box is selected, it allows specifying a matrix for the output gridding data. Output Matrix and Output Virtual Matrix can only one be selected.
See the syntax of Output Notations.
|
| Output Virtual Matrix
|
ovm
|
Output
Worksheet
|
<new>
|
If this check-box is selected, it allows specifying a worksheet for the output gridding data. And the output worksheet is arranged as a virtual matrix. Output Matrix and Output Virtual Matrix can only one be selected. And if input range contains multiple sets of Z columns, virtual matrix is not supported.
See the syntax of Output Notations.
|
Examples
- Create a new workbook and import the data <Origin Installation Directory>\Samples\Matrix Conversion and Gridding\XYZ Random Gaussian.dat into this workbook.
- Highlight column C and select Set As: Z from the right-click menu to set column C as Z column.
- Keep column C highlighted and select main menu Worksheet: Convert to Matrix: XYZ Gridding or run
XYZ2Mat -d; in the Command Window to open the XYZ Gridding dialog.
- Expand the Gridding Settings branch, choose Random (Renka Cline) from the Gridding Method and Parameters drop-down list, and 3D Color Map Surface from the Preview Plot Type drop-down list. Check the Preview check-box to the left of the OK button. In the Preview panel, select the Preview Result tab to show the result in 3D color map surface graph.
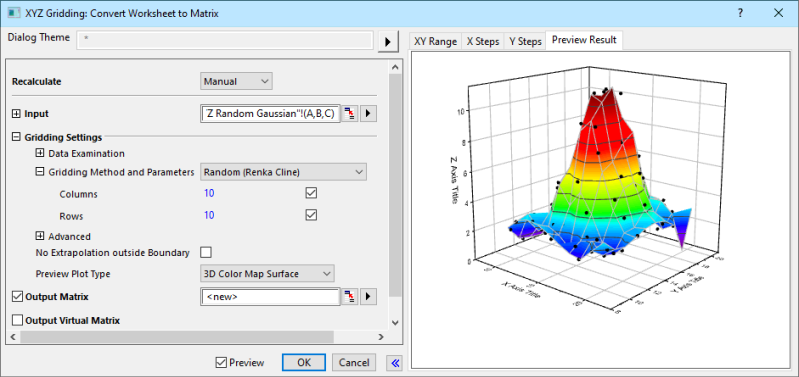
- Click the OK button to get the result as below.
Description
This X-Function convert XYZ worksheet data into matrix by XYZ Gridding. For more information, please refer to our User Guide: Description of XYZ Gridding Methods.
More Information
settings (Gridding Settings)
The settings (Gridding Settings) tree specifies the XYZ gridding settings.
Syntax: settings.Treenode:=<value>
Example: settings.ConvertToMatrix:=2
|
|
Treenode
|
Type
|
Default
|
Description
|
ExamData
(Data Examination)
|
XStepTol (Tolerance for Even X Step)
|
doule
|
1E-8
|
ExamData (Data Examination)
|
| YStepTol (Tolerancce for Even Y Step)
|
double
|
1E-8
|
| XPrecision (Tolerance for Duplicate X)
|
double
|
1E-8
|
| YPrecision (Tolerance for Duplicate Y)
|
double
|
1E-8
|
| RemoveDuplicate (Replace Duplicate With)
|
int
|
0
|
ConvertToMatrix
(Gridding Method and Parameters)
|
columns (Columns)
|
int
|
20
|
Gridding Method and Parameters
|
| rows (Rows)
|
int
|
20
|
| QILF (Quadratic Interpolant Locality Factor)
|
double
|
18
|
| WFLF (Weight Function Locality Factor)
|
double
|
9
|
| searchradiu (Search Radius)
|
doule
|
2
|
| averadius
|
double
|
2
|
| minipoints (Minimum Points)
|
double
|
10
|
| maxipoints (Maximum Points)
|
double
|
100
|
| CorrelationSmoothing (Smoothing)
|
int
|
1
|
| TPSSmoothing (Smoothing)
|
int
|
0
|
| extrapolation (Extrapolation)
|
int
|
0
|
| outsizevalue (Outside Value)
|
int
|
0
|
| tolerance (Tolerance)
|
double
|
0.005
|
advanced
(Advanced)
|
SelectRange (Range Restriction)
|
treenode
|
|
Advanced
- xmin (X Minimum): 0
- xmax (X Maximum): 0
- ymin (Y Minimum): 0
- ymax (Y Maximum): 0
|
noextrapolation
(No Extrapolation outside Boundary)
|
|
int
|
0
|
No Extrapolation outside Boundary
|
previewplottype
(Preview Plot Type)
|
|
int
|
1
|
Preview Plot Type
|
Algorithm
Related X-Functions
w2m, m2w, r2m, wexpand2m, xyz_regular, xyz_sparse, xyz_shep, xyz_shep_nag, xyz_renka, xyz_renka_nag, xyz_tps
Keywords:worksheet, gridding
|