2.2.27 reducexy
Menu Information
- Worksheet: Reduce by Group
- Analysis: Data Manipulation: Reduce by Group
Brief Information
Reduce XY data using subgroup stats on X
Additional Information
Minimum Origin Version Required: 8.1 SR0
More options are introduced since 2015 SR0
Command Line Usage
1. reducexy iy:=(col(A),col(B)) subgroup:=inc xincr:=0.5 xstats:=median ystats:=min;
2. reducexy iy:=(col(A),col(B)) subgroup:=points points:=8 xstats:=ave ystats:=ave;
X-Function Execution Options
Please refer to the page for additional option switches when accessing the x-function from script
Variables
Display
Name
|
Variable
Name
|
I/O
and
Type
|
Default
Value
|
Description
|
| Input
|
iy
|
Input
XYRange
|
<active>
|
Specifies the input data range.
|
| SubGroup Method
|
subgroup
|
Input
int
|
0
|
Specifies the method to divide the source data into subgroups. Then data points in each group will be merged into a single data point.
Option list:
- 0=points:By Every N Points
- Every N points in the source data is grouped into a subgroup. You can specify the value of N with the points variable.
- 1=groups:By Number of Groups
- You specify a number m with the groups variable. Then the source data is divided into m groups.
- 2=inc:By X Increment
- You specify an increment with the xincr variable. Then the X range of the source data is divided into sub-ranges according to the increment. Data points in each sub-range is grouped into a subgroup.
- 3=ref:By Reference Column(s)
- You specify an increment with the ref variable. Then the source data is divided by the reference column
|
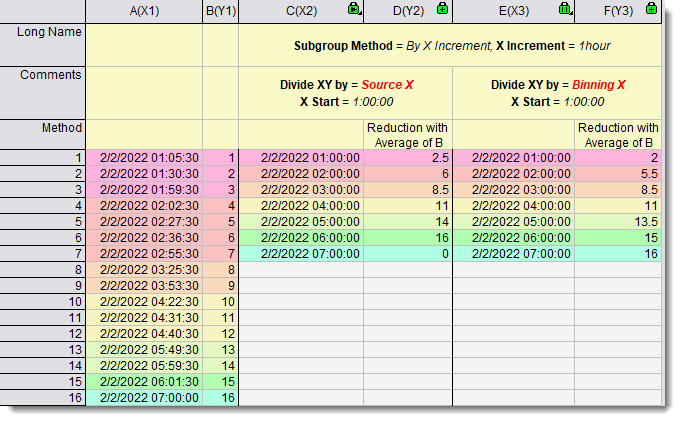
| Divide XY by
|
divide
|
Input
int
|
src
|
Available when SubGroup Method(subgroup) set to By Number of Groups(roups) and By X Increment(inc). Determine how to divide input XY datasets into subgroups.
Option list:
- 0=src:Source X
- Use the source X values to define subgroups. X Start/X End is only used to construct the output X range
- 1=bin:Binning X
- Use X Start as 1st subgroup starting to define subgroups.
- Please see below sample to see the difference of these two options:
|
| N
|
points
|
Input
int
|
<auto>
|
This is only available when By Every N Points is selected in SubGroup Method. It specifies a number n. Then every n data points in the input range are merged into one data point.
|
| X Increment
|
xincr
|
Input
double
|
<auto>
|
This is only available when By X Increment is selected in SubGroup Method. It specifies a value dx. Then the input data points are divided into several groups using dx so that for any two data points which belong to the same group, the difference in their X values cannot exceed dx. After grouping, each group of data points will be merged into one. When xincr is not specified, its default value is automatically calculated by the this equation: xincr = end-start / nsize * 5, where nsize is the number of input data points.
|
| Groups
|
groups
|
Input
int
|
<auto>
|
This is only available when By Number of Groups is selected in SubGroup Method. It specifies the number of groups.
|
| X Start
|
start
|
Input
double
|
<auto>
|
Specifies the X value to start grouping.
|
| X End
|
end
|
Input
double
|
<auto>
|
Specifies the X value to end grouping.
|
| Reference Column(s)
|
ref
|
Input
Range
|
<optional>
|
Specifies the reference column(s), when SubGroup Method is set to ref By Reference Column(s).
|
| Merged X by
|
xstats
|
Input
int
|
0
|
Specifies the way to pick the X value of the output data point, into which a group of data points are merged.
Option list:
- ave:Average
- The average of the X values of the data points in each group.
- median:Median
- The median of the X values of the data points in each group.
- first:First in Subgroup
- The X values of the first data point in each group.
- last:Last in Subgroup
- The X values of the last data point in each group.
- xatminy:X of Min Y
- The X value of the minimum Y value of each group.
- xatmaxy:X of Max Y
- The X value of the maximum Y value of each group.
The next three items are available when SubGroup Method is By X Increment or By Number of Groups.
- begin:Subgroup Beginning
- The beginning value in each subgroup.
- center:Subgroup Center
- The center value in each subgroup.
- end:Subgroup End
- The end value in each group.
|
| Merged Y by
|
ystats
|
Input
int
|
0
|
Specifies the way to pick the Y value of the output data point, into which a group of data points are merged.
Option list:
- ave:Average
- The average of the Y values of the data points in each group.
- min:Min
- The minimum of the Y values of the data points in each group.
- The maximum of the Y values of the data points in each group.
- median:Median
- The median of the Y values of the data points in each group.
- first:First in Subgroup
- The Y values of the first data point in each group.
- last:Last in Subgroup
- The Y values of the last data point in each group.
- sum:Sum
- The sum of the Y values of the data points in each group.
- sd:SD
- The standard deviation of the Y values of the data points in each group.
- se:SE
- The standard error of the Y values of the data points in each group.
- rms:RMS
- The Root-Mean-Square of the Y values of the data points in each group.
|
| Output
|
oy
|
Output
XYRange
|
<new>
|
Specifies the output range.
See the syntax here.
|
| Output Group Info
|
rd
|
Output
ReportData
|
[<same>]<same>
|
When SubGroup Method is set to ref By Reference Column(s), you can use this option to output the group information from the reference columns
|
Description
This X-function allows you to reduce XY data based on X values. The X values are required to be monotonic.
It provides multiple methods to group the data. After being grouped, each group of data points are merged into a single data point. You can specify the way to pick the X and Y values of the output data point.
Example
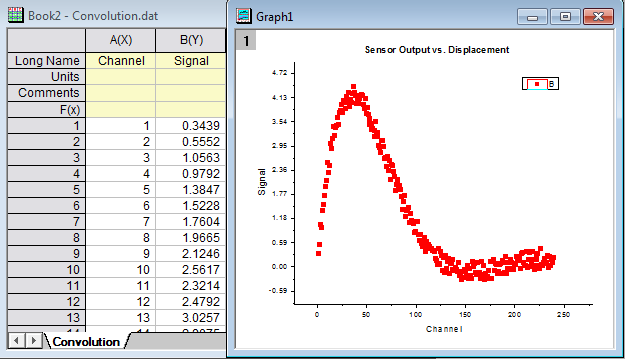
There is a dataset whose X values are not evenly spaced, and you want to reduce the data according to the X values. The dataset contains 200 data points. If you perform the following steps, you will get 50 of them:
- Start with a new book and click Import Single ASCII button
 and import file \Samples\Signal Processing\Convolution.dat. and import file \Samples\Signal Processing\Convolution.dat.
- Highlight the data columns and then select Plot: Symbol: Scatter from the Origin menu to create a graph.
- Select Analysis: Data Manipulation: Reduce by Group from the main menu to open the dialog box of the reduceXY X-Function.
- In the dialog box, select By Number of Groups with the SubGroup Method drop-down list. Then uncheck Auto checkbox to the right of Groups and enter 50 in the edit box.
- Select First in Subgroup with the Merged X by drop-down list.
- Select Min with the Merged Y by drop-down list.
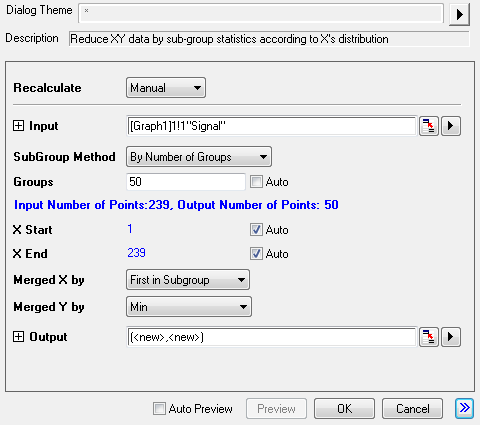
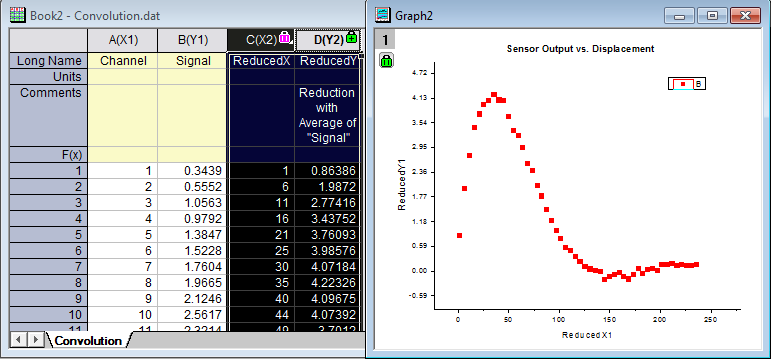
- Click the OK button. The results are saved in the input worksheet next to the raw data. Highlight X2 and Y2 columns and then select Plot: Symbol: Scatter from the Origin menu to create a graph.
You can also use the following script command to reduce the data points:
reducexy -r 2 iy:=[Book2]Convolution!(col(A),col(B)) subgroup:=groups groups:=50 xstats:=first ystats:=min;
Related X-Functions
stats, reducedup, xy_resample
Keywords:data reduction, average, mean, sum, minimum, maximum, statistics, binning
|