2.2.6 assays
Menu Information
assays Template Configuration
Brief Information
Set up data format and fitting function for Assays Template
Command Line Usage
1. assays designation:=XYYY replicates:=2
2. assays designation:=XYYY replicates:=2 category:="Origin Basic Functions" function:="Gaussian" recalculate:=1
X-Function Execution Options
Please refer to the page for additional option switches when accessing the x-function from script
Variables
Display
Name
|
Variable
Name
|
I/O
and
Type
|
Default
Value
|
Description
|
| Worksheet
|
w
|
Input/Output
Worksheet
|
[<active>]"Raw Data"
|
The name of input and output worksheet, which can be only defined as "Raw Data".
|
| Report Sheet Name
|
name
|
Input
string
|
Fitted Result
|
Name of the report sheet, which can be only defined as "Fitted Result".
|
| Column Designation
|
designation
|
Input
int
|
XY
|
Specify the designation of the input data.
Option list
- XY : XY XY
- One X column corresponding with one Y column
- XYYY : XYYY
- One X column with multiple Y columns.
|
| Replicates
|
replicates
|
Input
int
|
1
|
Specify the repeated times of the designation. For example, if you select XYXY in Column Designation and 2 in Replicates, you will get four columns with "X" "Y" "X" "Y" designations.
|
| Function Category
|
CategoryList
|
Input
string
|
Origin Basic Function
|
Specify the category of the fitting function.
|
| Function
|
FunctionList
|
Input
string
|
Gauss
|
Specify the name of the fitting functions.
|
| Recalculate Now
|
recalculate
|
Input
int
|
0
|
This check box determines whether automatically recalculate now or not.
|
Description
This X-function is used to set up data designation and fitting function for assays Template. It is mainly used with assays.ogw, located in \Templates\Analysisg folder.
If you fitted a NLFit, you can use this dialog to set up the data format as well as the fitting function. The newly fitted result will be automatically stored in the "Fitted Result" worksheet.
Note: This X-function is only suited for nonlinear curve fitting, so make sure that your fitting is NLFit and use this X-function to change some settings. While if you want to use the Recalculate Row check box, male sure that your "NLFit" recalculate is set as Auto.
Examples
Use the assays.ogw as an example to explain the usage of this X-function.
- Open the assays.ogw located in \Templates\Analysis folder.
- Active the "Raw Data" worksheet and import the Polynomial Fit.dat in \Sample\Curve Fitting folder. Then it will do the non-linear dose response fitting automatically. (Please do not rename sheets in this book.)
- Click the Config button in the left top of the "Raw Data" worksheet and open the assays dialog box.
- Set the parameters as following:
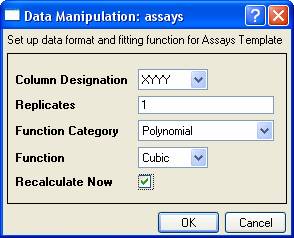
- Click OK button. The cubic fitting result with column A and B as the input data will be stored in "Fitted Result" worksheet.
Note that, you can active "FitNLFindXfromY1" sheet or "FitNLFindYfromX1" sheet, type desirable X/Y values in the first column.
Make the sheet named "Calibration Plot" active. It contains a summary graph of the data, the fit curves. You may need to double-click and open the graph as a separate window and then rescale it in order to refresh it. You can then close the window to put the updated graph back into the book.
|