4.3.7 Sampling IntervalWksCol-SampleInterval
What is Sampling Interval
Plotting and many analysis routines require the X values of the data. Normally, the X values of a data column are saved in another worksheet column. However, for data with evenly-spaced X values (for example, waveform data), we have another option—saving the offset, the increment and the unit of the X values in the Sampling Interval header row of the data column.
One benefit of using the Sampling Interval header row is that it helps to save memory. Also, Origin can use the information stored in this header row for all operations such as plotting and analysis. For example, in the Plot Setup dialog, you can choose to plot a data column against <AutoX>, the X values defined by the information in the Sampling Interval header row. If you do want to have the column with the X values, you can easily generate one with the Sampling Interval information.
The information in the Sampling Interval header row can be automatically generated by some importing and analysis routines. Also, you can create and edit it manually, by using tools that are shipped with Origin. Updating the information will trigger recalculate, if the data column is an input column of an operation.
|
Notes:
- The precision of the number displayed in the Sampling Interval header row is controlled by the Numeric Format tab of the Preferences: Options dialog, while internally the values are full precision and can be found in the metadata viewed with the Workbook Organizer.
- You can set sampling interval for X, Y and Z columns.
|
Setting and Clearing Sampling Interval Information
You cannot directly edit the information in the Sampling Interval header row. However, you can use the following tools to create/modify/clear it.
Set Sampling Interval
The colint X-Function is capable of adding, modifying, removing the information in the Sampling Interval header row.
The dialog of this X-Function can be opened by:
- Selecting from the main menu.
- By double-clicking on the column's Sampling Interval cell.
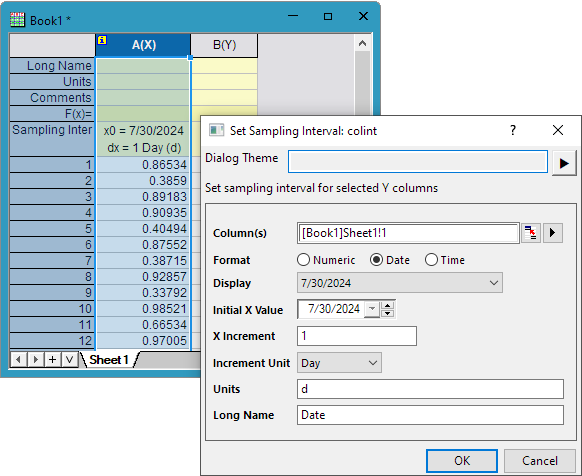
Format
Select Numeric, Date or Time Sampling Interval
Display
This drop-down list is available only when Format is either Date or Time.
When Format = Date
When Format = Time
Initial X Value
The Initial X Value set by this dialog is displayed as x0 in the Sampling Interval header row.
The available options vary depending on the selection in the Format.
When Format = Date, select a data in the calendar. When Format = Time, enter a time as the format that select in Display drop-down list.
X Increment
X Increment is displayed as dx in the Sampling Interval header row. By default, the X Increment is 1.
Increment Unit
This drop-down list is available only when Format is either Date or Time. Specify the date/ time unit for the increment value.
Unit
Set Unit in this dialog, and it will be also contained in the Sampling Interval header row.
Long Name
You can specify the long name for the X column, then it will be created from the information in the Sampling Interval header row later.
To modify the existing information in the header row, just open this dialog again, make any necessary change and click OK.
This dialog can be used to clear the information in the header row, too. Open this dialog and then set both Initial X Value and X Increment to 1 (the default value).
Column Additional Information
If the Sampling Interval header row is not empty, you will see a yellow icon with the letter "i" on the top left corner. Clicking on this icon will open the Column Additional Information dialog, which allows you to edit the sampling interval information and view the header information, if the data in this column is imported from a SPC file.
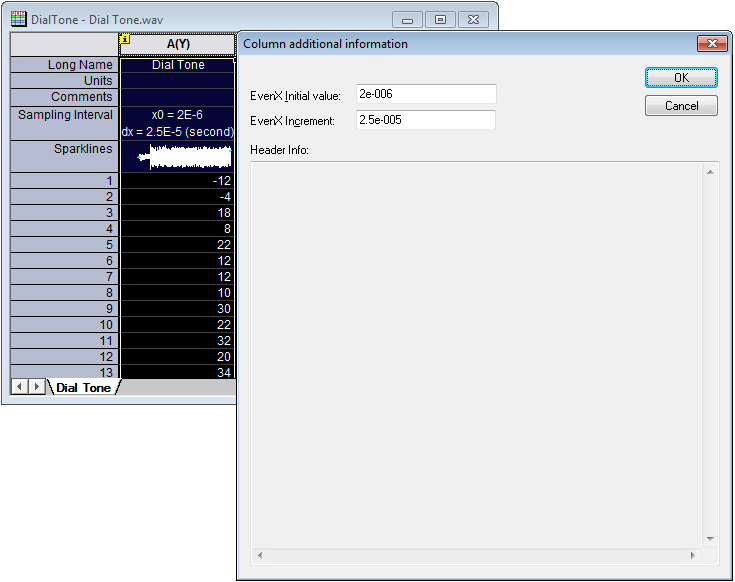
The EvenX Initial value edit box in the dialog corresponds to x0 information in the header row, while the EvenX Increment edit box enables you to edit the dx information in the header row. Setting both values to 1 can remove the information in the header row, because 1 is the default value.
The Header Info area in the Column Additional Information dialog displays the header information imported from the SPC file where the data is from. If the data in the column is not imported from a SPC file, this area will be empty.
Creating an X Column from the Sampling Interval
You can create an X column (a column of X values) from the information in the Sampling Interval header row. Note that the plot designation of this column is Disregard by default.
To create an X column from a sampling interval, highlight the data column and then select from the Origin menu.
If you have set a long name in the Set Sampling interval tool (the colint X-Function), the long name will be applied to the X column.
|