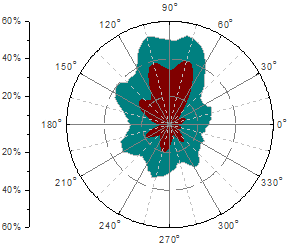
29.13.9 Polar GraphPolar-Graph
Data Requirements
Select at least one pair of XY columns. When using Polar θ(X) r(Y) to plot a graph, X represents the Angular (Units are in degrees) and Y is the Radius, and when using Polar r(X) θ(Y), X is the Radius and Y represents the Angular (Units are in degrees).
Creating the Graph
Take Polar theta(X) r(Y) for example.
- Select required data.
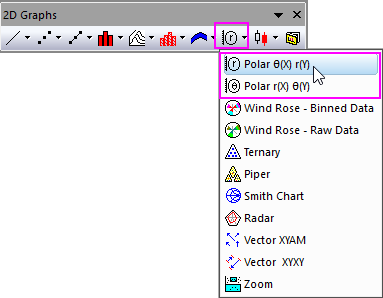
- From the menu, choose .
- or
- Click the Polar theta(X) r(Y) button on the 2D Graphs toolbar.
- Bar Polar: From menu, choose .
- Line+Symbol Polar: From menu, choose .
- Symbol Polar: From menu, choose .
Template
POLAR.otpu for Polar θ(X) r(Y).
PolarXrYTheta.otpu for Polar r(X) θ(Y).
POLARTHETARLINE+SYMBOL.otpu for Line+Symbol θ, r
PolarRThetaLine+Symbol.otpu for Line+Symbol r, θ
POLARTHETARSCATTER.otpu for Symbol θ, r
PolarRThetaScatter.otpu for Symbol r, θ
POLARTHETARBAR.otpu for Bar θ, r
PolarRThetaBar.otpu for Bar r, θ
(All above are installed to the Origin program folder).
Controls
To control the polar axis, refer to this online help.
|