29.9.30 Network PlotNetwork-Plot
Data Requirements
Origin supports three type of input data to plot a network plot.
- Adjacency Matrix
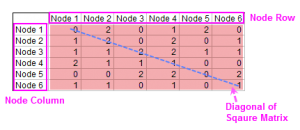
- An adjacency matrix is a square matrix used to represent a finite graph. The elements of the matrix indicate whether pairs of vertices are adjacent or not in the graph.
- Incidence Matrix
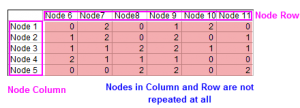
- An incidence matrix is a logical matrix that shows the relationship between two classes of objects, usually called an incidence relation.
- Edge List
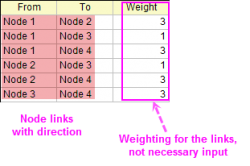
- An edge list is a data structure used to represent a graph as a list of its edges. Use this arrangement for plotting on maps.
Creating the Graph
Highlight the source data and open the plot_network dialog by either of the following:
- select Plot > Categorical: Network from top menu
The plotnetwork Dialog Box
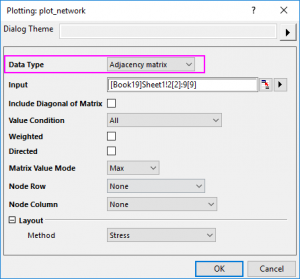
| Input Data = Adjacency Matrix
|
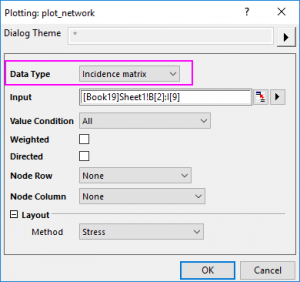
Input Data = Incidence Matrix
|
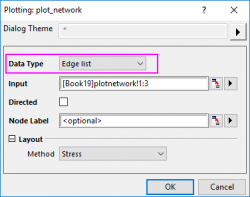
Input Data = Edge List
|
|
|
|
|
|
|
Include Diagonal of Matrix
Specify whether include the self-feedback connecting information stored in the diagonal of the matrix. This option is only available for Input Data = Adjacency Matrix.
Value Condition
This control can be used to set a filter for the matrix values to plot the links between the nodes. Only the values matching to the condition will be plotted as links.
For Between and Not Between, Min and Max edit box will show up; for others except All, Value edit box will show up.
For the adjacency matrix above, when you selected Include Diagonal of Matrix, set Value Condition to Less Than = 2, the value more than or equal to 2 was supposed to be filtered.
Weighted
Specify whether add weighting on the links between the nodes. Once you checked this check box, the values for the links will be used to calculate a distance matrix which is used to define the XY location of the nodes.
Directed
Specify whether using an arrow to show the direction of each link.
Once you selected this, you can decide the Direction: From Row to Column or From Column to Row.
Matrix Value Mode
Specify how to pick the plot value between two nodes, without considering the link direction. This option is only available for Input Data = Adjacency Matrix, but not available when the Directed check box above has been chose.
- Upper: Only plot the values in the upper right triangle of the matrix, including the value at the diagonal.
- Lower: Only plot the values in the lower left triangle of the matrix, including the value at the diagonal.
- Min: For the values between two nodes, only plot the minimum. If you have a square matrix A, plot the value min(A(i,j),A(j,i)) as the link for Node i and Node j.
- Max: For the values between two nodes, only plot the maximum. If you have a square matrix A, plot the value max(A(i,j),A(j,i)) as the link between Node i and Node j.
- Plus: For the values between two nodes, plot the sum. If you have a square matrix A, plot the value A(i,j) + A(j,i) as the link between Node i and Node j.
Node Row/Node Column
Specify the Node Row and Node Column to define the node arrangement.
Node Label
For the Edge list data, if the input node links are not categorical data, you can use this option to specify the node labels.
Layout
Specify how to position the nodes. Origin supports 8 general layouts:
- Fruchterman-Reingold:Place nodes on the plane using the force-directed layout algorithm by Fruchterman and Reingold.
- Kamada-Kawai: Place nodes on the plane, or in the 3d space, based on a phyisical model of springs.
- MDS: Multidimensional scaling of some distance matrix defined on the nodes of a graph. When you select this layout, you can selectively set a matrix to define the distance between the nodes.
- Stress: force-directed graph layout based on stress majorization.
- Circle: Place nodes on a circle, in the order of their vertex ids. This one is simple, just put each node to circle, order could be node column order
- Pivot MDS: Similar to MDS but uses only a small set of pivots for MDS. Considerably faster than MDS and thus applicable for larger graphs.
- Sparse Stress: stress majorization for larger graphs based on a set of pivot nodes.
- ForceAtlas2: ForceAtlas2 is a force-directed layout close to other algorithms used for network spatialization. ForceAtlas2 is a force directed layout: it simulates a physical system in order to spatialize a network. Nodes repulse each other like charged particles, while edges attract their nodes, like springs. These forces create a movement that converges to a balanced state. This final configuration is expected to help the interpretation of the data.
Besides, you can select Custom to define the position of nodes by another XY range.
Template
network.otpu (installed to the EXE folder of Origin)
Notes
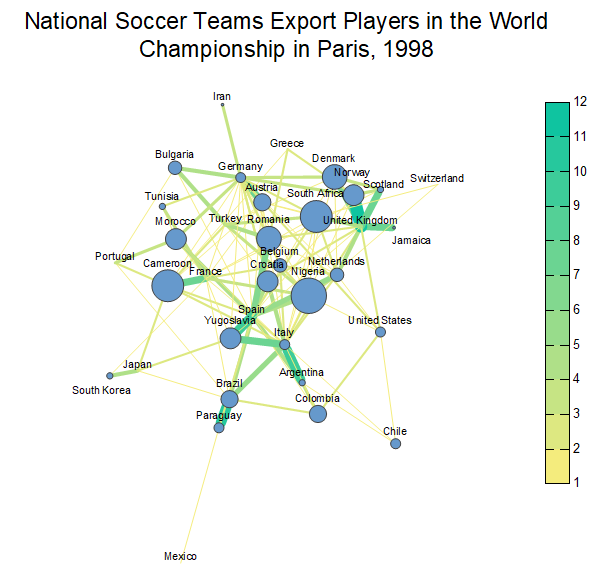
- Network plots show interconnections between a set of entities. Each entity is represented by a Node and connections between nodes are represented by links.
- No matter which Data Type has been selected in the plot_network dialog, an intermediate worksheet plot_network# will be created to store the link from and link to, link weight, node name and node location.
- When the Data Type = Edge list, the From, To and Name columns are automatically Set as Categorical in the intermediate worksheet, with the sort order defaulting to Unsorted (i.e. categories are listed in the order of appearance in the source column).
To further customize the node and links, you can go to the tabs below of Plot Details:
|