11.2 The Quick Sigmoidal Fit GadgetGadget-QuickSigmoiFit
Overview
The Quick Sigmoidal Fit gadget allows you to fit a sigmoidal curve on a graph. This gadget is similar to the Fit Sigmoidal tool in Origin 7.5, but provides more advanced controls.
With the Quick Sigmoidal Fit gadget, you can:
- Change the fitting data range by simply moving and resizing the ROI.
- Change the input dataset and fitting function from the fly-out menu.
- Fit all data in the graph in concatenate mode and show mean+SE or mean+SD inside the ROI.
- Fit curves with weighting.
- Show fixed asymptotes and parameter values on a graph.
- Output the fit results to a worksheet
- Launch the advanced NLFit tool using Gadget settings for data range, function, and parameter values
- Find specific/new X/Y values using the fit curve
- Save settings, including function, to a Theme file for repeat use
To Open Quick Sigmoidal Gadget
To use the Quick Sigmoidal Fit gadget to perform a sigmoidal fit in the ROI (Region of Interest) range, with a graph window active, click Gadgets, and then click Quick Sigmoidal Fit to open.
To Show or Hide Gadget Tool
To toggle the display of all gadget ROI boxes in a graph at the same time, click the H button  in the top right corner of the graph, which enables users to export the graph with gadget results. in the top right corner of the graph, which enables users to export the graph with gadget results.
Settings Tab
Select a function to perform the sigmoidal fitting. All the functions under Growth/Sigmoidal or Pharmacology categories are available from the drop-down list. You also can add your own functions to these two categories using the Fitting Function Builder or Fitting Function Organizer.
| Note: This tab is only available in the Addtool_sigmoidal_fit dialog when you start this tool, not in the Preference dialog.
|
ROI Box Tab
| X Scale
|
Specify the X data range for the ROI.
- From
- The beginning of the X scale.
- To
- The ending of the X scale.
- Fixed (Prevent moving by ROI)
- Fix the X scale to prevent from moving by ROI box.
|
| Show Tool Name
|
Specify whether to show the tool's name near the top of the ROI.
|
| Show Rectangle after Fit
|
Specify whether to show the rectangle over the graph after fitting.
|
| Significant Digits
|
Specify the significant digits. The system significant digits can be set in the Numeric Format tab of Options dialog.
|
| Show on Center-Top of ROI Box
|
Specify what to show on the center-top of ROI box. Options: Reduced Chi-Sqr and Adj. R-square.
|
| Parameter List
|
Specify which parameters of the current function show on the center-top of ROI box.
|
| Asymptote
|
Specify whether show the asymptote lines in the ROI box and specify the line color.
|
| Fill Color
|
Specify the ROI fill color.
|
| Fit Curve Color
|
Specify the color of fit curve.
|
Label Box Tab
Elect to add a label of fit results to the graph when you choose New Output from the fly-out menu, and choose what to show in the label.
| Add Label Box to Graph
|
Specify whether to add label box to graph when new output.
|
| Significant Digits
|
Specify the significant digits. The system significant digits can be set in the Numeric Format tab of Options dialog.
|
| Function
|
Specify whether to show the function name in the label box.
|
| Date & Time
|
Show the date and time of analysis in the label box.
|
| Input
|
Specify whether to show the input dataset in the label box. You can select appropriate format from the drop-down list.
|
| Range
|
Specify whether to show the input data range in the label box. You can specify to show the indices or X values.
|
| Output
|
Specify whether to show the output dataset in the label box. You can select appropriate format from the drop-down list.
|
| Add Legend Symbols
|
Specify whether to show the legend symbols in the label box.
|
| Weighting
|
Indicate whether weighting was used in performing the fit and if so, the method of weighting.
|
| Equation
|
Specify whether to show the function equation in the label box. You can select to show the equation with parameter values or parameter names.
|
| Parameter Table
|
Specify whether to show the parameter table in the label box. You can specify show parameters selected in the ROI Box tab or all parameters.
|
| Show Error in Parameter Table
|
Specify whether to show the parameter errors in the parameter table.
|
| Reduced Chi-Sqr
|
Specify whether to show Reduced Chi-Sqr value.
|
| Adj. R-Square
|
Specify whether to show Adj. R-Square value.
|
Report Tab
The settings in this tab are almost same as those documented in the Label Box tab above. Note that you can output information specified on the Report tab to a worksheet, either in the same workbook or to a separate workbook, as described here:
| Output To
|
Specify output report destination: None, Script Window, Result Log or Worksheet.
If you choose to send output to a Worksheet, you have these options:
- When you generate new output, results are output to [%H-Sgfit]Result by default (here %H means the Short Name of source graph). You can also type a book and sheet name in the form of [BookName]SheetName directly into the edit box and when you choose New Output (O), results will be output to that book and sheet. If the book and sheet do not exist, they will be created.
- You can click the flyout button
 to the right of Worksheet Name and choose Sheet in Input Book. This fills the edit box with [<input>]Result. When you choose New Output (O), results will be output to a sheet named Result in the source book. to the right of Worksheet Name and choose Sheet in Input Book. This fills the edit box with [<input>]Result. When you choose New Output (O), results will be output to a sheet named Result in the source book.
|
Fit Curve Tab
| Plot Type
|
Specify the Plot Type for the fitted curve.
- Raw Data
- Output the fitted curve of source data.
- Mean,SD
- Output the fitted curve with mean and standard deviation of all source plots.
- Mean,SE
- Output the fitted curve with mean and standard error of all source plots.
|
| X Data Type
|
Specify how to generate the X values of the fitted curve.
- Same X as Source Data
- The X values of the fitted curve are the same as the input X values.
- Use Source Graph Scale Type
- The X values of the fitted curve are plotted on the source data scale type.
- Uniform Linear Scale
- The X values of the fitted curve are plotted on an equally-spaced linear scale.
|
| Number Points
|
Specify the number of data points for fitted curve.
|
| Range
|
This control is available only when X Data Type is either Uniform Linear or Log. It specifies the range of the X values of the fitted curve. Select one of the following options:
- Use Input Data Range + Margin
- Use the X range of the input data and range margin specified in the Range Margin (%) text box below.
- Span to Full Axis Range
- Span the X values to the full axis range.
- Custom
- Enter the minimum X value and maximum X value in the Min and Max edit boxes below.
|
| Range Margin(%)
|
This control is available only when Use Input Data Range + Margin is selected for Range. It specifies the range margin into which the fitted curves extend.
|
| Output Fit Curve To
|
Specify the fitted curve data destination.
|
Parameters Tab
Set the initial values for the parameters. Check the Fixed check box to fix the parameter values.
Fit Control Tab
Specify the weighting method for the fitting. See details about fitting with weighting.
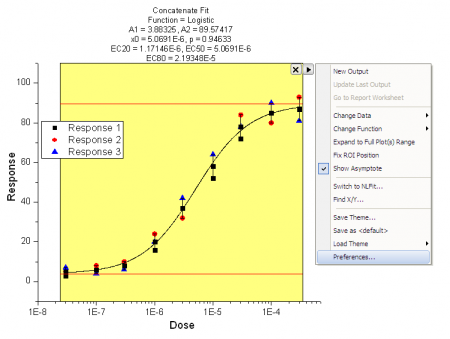
Fly-out Menu
| New Output
|
Output results what specified in Label Box or Report branch.
|
| Update Last Output
|
Update the last Label Box and the Report output.
|
| Go to Report Worksheet
|
Active the report worksheet if it was created.
|
| Output to Clipboard
|
When selected (menu item checked) New Output will be placed on the Clipboard.
|
| Change Data
|
Change fitting data/plot. By default, all plots in current layer will be selected.
- Clear the check marks in front of All Plots to deselect all.
- Clear the check mark in front of any plot to deselect that plot.
- Click Select... or More... to open the Select Plot(s) dialog.
|
| Change Function
|
Change fitting function. Click the More in the context menu to open the Sigmoidal Fit Function List dialog to add more functions to the function list.
|
| Expand to Full Plot(s) Range
|
Expand the ROI to full plot range.
|
| Fix ROI Position
|
Fix the ROI at current position.
|
| Show Asymptote
|
Show the asymptote lines.
|
| Switch to NLFit...
|
Open the NLFit dialog. The data range selected by ROI box will be used as input data range in the NLFit dialog. The settings, such as fix status of parameters and weighting method, will be passed to the NLFit dialog after switch.
|
| Find X/Y...
|
Open the Find X/Y dialog, which can be used to calculate the X/Y values for given Y/X.
|
| Save Theme...
|
Save the Quick Sigmoidal Fit settings as theme.
|
| Save as <default>
|
Save current settings as default theme.
|
| Load Theme
|
Load the pre-saved theme of Quick Sigmoidal Fit.
|
| Preferences..
|
Open the Sigmoidal Fit Preferences dialog to do further settings for fitting.
|
|