23.2.3 The Export Graph Dialog BoxExpGraph-Dailog
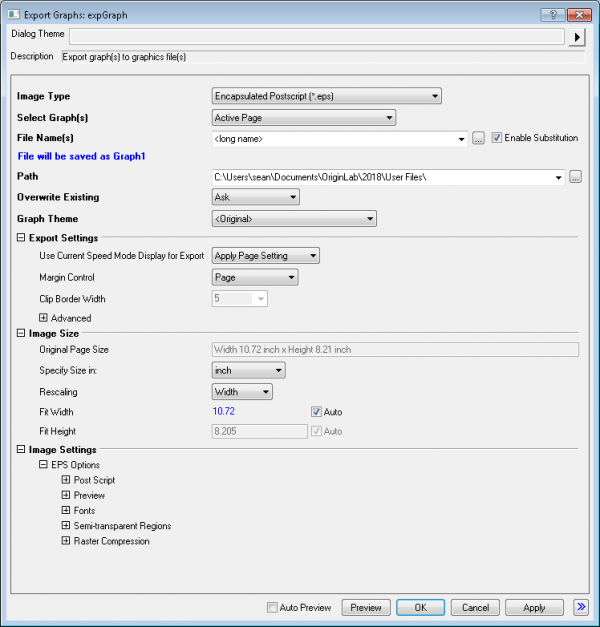
This page provides a simplified description of the most commonly used controls in Export Graph dialog. For a more detailed description of the controls, please refer to [[UserGuide:Settings_in_Export_Graph_Dialog|Settings in The Export Graph Dialog Box]].
Image Type
| Image Type
|
Select the desired export image type from this drop-down list. Note that the list is organized alphabetically and provides a wide selection of vector and raster formats.
For information on choosing a format, see Which Format Should I Choose?
|
Select Graph(s)
| Select Graph(s)
|
Select the page(s) to be exported.
- Active Page: The active graph page
- All in Active Folder : All graph pages in active folder of the project, including hidden pages. Graph pages in subfolders, and graphs embedded in worksheets will not be included.
- All in Active Folder (Recursive): All graph pages in active folder and all subfolders thereof
- All in Active Folder (Open): All open (not hidden) pages in active folder of the project
- All in Active Folder (Include Embedded): All graph pages in active folder of the project, including hidden pages and graphs embedded in worksheets
- All in Project: All graph pages in the project, including hidden pages, but excluding embedded pages
- Specified: Specify pages by name in the Graph Pages list below. Note that the list will be loaded based on previous selection of the drop-down. A browse button is provided to open the Graph Browser dialog.
|
Export as multi-page PDF file (PDF)
This option is only available when there are multiple graph pages selected to export as a PDF file.
Check this box to export the multiple graph pages to one PDF file with multi-pages.
| Note: By default, the PDF page size fits to the dimension of the graph in Origin (system variable @MPGS= 1).
|
Export as multi-frame TIF file (TIF)
This option is only available when there are multiple graph pages selected to export as a TIF file.
Check this box to export pages to a single TIF image (TIF stack).
 | To export a Browser Graph as GIF, TIF stack, or AVI, use Flip Through to export.
|
File Name(s)
| File Name(s)
|
Specify the name(s) for the exported image file(s).
- <Long Name> : Use the long name of the graph page
- <Short Name>: Use the short name of the graph page
- Graph ## : Enumerate by the order in Graph Page list
- Graph<pound># : Enumerate by the order in the Graph Page list, and include the "#" character
|
| Enable Substitution
|
When the box is checked, LabTalk substitution is supported for specifying the File Names. A hint text is displayed below File Name(s), displaying the substituted string that will be used for the file name.
|
Note:
- File Name supports combinations of keywords and literal string, such as <longname>-Journal1, the long name of the graph and the string -Journal1 will be used as the export file name.
- <pound>, representing the character "#", can also be used without combining with graph index. For example, Set File Name(s) as Graph<pound>2 then the display graph name would be Graph#2.
|
Path
| Path
|
The file path to save the exported image file(s).
- <User File Folder>: User file folder (UFF)
- <Project Folder>: The folder where where the current project (OPJ) is located
- <PE Path>: Refers to the folder structure in Project Explorer. For example, <Project Folder><PE Path> means exporting graphs into sub-folders of the current project folder, with the same folder structure as in Origin's Project Explorer. This keyword requires Origin 2017 and higher versions.
|
Overwrite Existing
| Overwrite Existing
|
Specify whether to overwrite the existing file(s)
- rename:Auto Rename : Auto rename with enumeration
- replace:Replace: Replace existing file(s)
- skip:Skip: Skip existing file(s)
- ask:Ask: Open message box with options
|
Graph Theme
| Graph Theme
|
Optionally select a graph theme to be applied "on the fly" when exporting the graph. The theme will not affect the existing graph page(s). For example, you can select the B&W Publication theme to convert your graphs to black and while while exporting, without changing any colors in the existing graph page.
|
Export Settings
| Use Current Speed Mode Display for Export
|
- Apply Page Settings: Use the Speed Mode setting of the graph page
- On: Turn on Speed Mode for export even if graph page has Speed Mode off.
- Off: Turn off Speed Mode for export even if graph page has Speed Mode on.
|
| Margin Control
|
This drop-down controls what area of the graph window will be exported. In the text below, graph page area refers to the page size settings in the Printing/Dimensions tab of the Plot Details dialog. For more details on use of these settings, see The Copy/Export Page settings group.
- Auto: Export the graph using the Preferences: Options > Page tab Copy Page settings, plus any adjustment made using the Export Margin Offsets dialog box.
- Border: Use a tight bounding box† to include all elements in the graph window, plus add a border specified by the Clip Border Width control. Elements such as text labels outside of the graph page area will also be included.
- Tight: Same as above, but without an added border.
- Page: Export the graph page area. Leave out or clip elements that are (partially) outside of the graph page area.
- Tight in Page: Use a tight bounding box around all elements that are positioned fully/more than 50% area within the graph page area.
†Note: Starting with Origin 2018, you can both (1) view the bounding box and (2) affect the size of the bounding box, using the Export Margin Offset dialog box.
|
| Clip Border Width
|
Only available when Border is selected for Margin Control. Specify the border width to be added to the export area. The value is in percentage of the width of the bounding box.
|
| Advanced
|
These settings apply ONLY to vector export formats. It is recommended that you leave these settings at their default values, unless you find issues with the exported image such as skewed or stretched symbols, improperly sized columns or bars, and improper text label spacing.
- Set Resolution: If this option is selected, the Resolution setting will be used to determine the resolution of graph elements such as symbols, bars and other raster objects.
- Keep Size: This option will produce an output image that is closest to the specified image size
- Resolution: This control is only available when Set Resolution is chosen. Specify resolution in DPI.
|
Image Size
These settings determine the size of the exported image.
| Original Page Size
|
This non-editable control displays the original size of the graph page.
|
| Clipped Page Size
|
This non-editable control displays the clipped page size when Margin Control under Export Settings is set to any option other than the full page.
|
| Specify Size in
|
Use this drop-down to set output size in inches, cm, pixels, or ratio of original page size.
|
| Rescaling/Fit Width/Fit Height
|
This is useful when exporting graph to meet specification of a journal, such as scale image to 1-column or 2-column width for the journal, in inches or centimeters.
Select width or height from the Rescaling drop-down. You can then uncheck the Auto check box for width or height, and specify a desired value. Origin will automatically scale the other quantity to maintain the proper aspect ratio of the exported area.
|
| Ratio(%)
|
This is available if size is specified as a ratio. Set a percentage ratio to scale the page as desired.
|
Image Settings
This controls in this node will vary depending on the chosen export image type. Each image type such as EPS, PDF or TIFF have their own set of controls, which are documented in detail in this page.
Listed below are some of the most relevant controls for a few of the popular export formats.
Vector Formats (EPS, PDF)
| Preview
|
Since most applications (including MS Office applications) are incapable of displaying an EPS file, users may opt to generate a "preview" TIFF or WMF image when exporting to EPS.
|
| Fonts
|
- EPS files offer three Adobe font types (1,3,42) and three methods of rendering the font: Use Substitution, Use Built-In Fonts and Use Outline Fonts.
- Outline - the text is converted to graphics, so there is not font information inside the EPS file. This is generally the best option to keep if you are uncertain about whether the program you are exporting to has the font options you desire.
- Built-in Fonts - the selected fonts are going to be available on the device that renders the EPS file and thus allows further editing. When the EPS file is launched in an EPS application, the system will look for the same font in the application. If it cannot find that font an error or warning will appear.
- Use Substitution - keep the selected font in the EPS file. When the EPS file is launched in an EPS application, the system will automatically find a substitute if a matching font is not found.
- Descriptor Only - allows a rendering application or device to substitute a similar font.
- Embedded - ensure that your text is rendered as you intended it. It allows the text editing in the rendering application.
- Outline - convert text to graphics, which prevents further text edits of the PDF file.
|
| Semi-transparent Regions (EPS)
|
Use these settings if you have a applied transparency to some portion of your graph.
|
Raster Formats (TIFF, PNG, JPEG)
| DPI Resolution
|
Specify the resolution of the exported raster image in dots per inch. Note that if you set a large value such as 600 or 1200, you may want to then scale down the output width or height using the controls under the Image Size node, to limit the size of the exported file. For example, if the publisher requires a 1200 DPI file, they may only require the width to be 3.25 inches.
|
| Color Space
|
Generally, you would choose RGB for graphs to be rendered on a computer display and CMYK for graphs intended for print.
|
| Color Depth
|
This setting will matter most to those who are concerned about file size (particularly for TIFF files, which can be quite large). To limit file size, reduce the color depth.
|
| Compression
|
Both TIFF and JPEG formats offer compression options but only TIFF offers "lossless" compression (LZW, Packbits)
|
| If your Image tab Preview appears blank, you are likely viewing only a corner of a very large raster image. Starting with Origin 2019, you can right-click in the Image tab and choose a zoom level for previewing your raster or vector images. By manipulating the size of the Preview panel + the Image tab zoom level, you'll be able to view your entire graph.
|
|