5.7 Profiling Matrix DataView-Profile-MatData
Profiling Matrix or Virtual Matrix Data
You can create profile plots from matrix data or from worksheet data that are arranged in a virtual matrix. Once you have created apProfile plot, you can generate cross-sectional profiles of your plot, along vertical lines, horizontal lines or arbitrarily-placed lines:
- Activate the matrix containing the data to be profiled. If you are working with virtual matrix (worksheet) data, select your data range.
- Select Plot: Profile: Contour Profile / Image Profile. If the active window is a matrix, a profile plot is created and the Image/Contour Profile dialog box is opened. If the active window is a worksheet (virtual matrix) and you have selected your worksheet data, the plotvm dialog box will open, wherein you will specify how to treat the worksheet data as a virtual matrix. Upon clicking OK, a profile plot is created and the Image/Contour Profile dialog box is opened.
| Note: Your Profile plot may display a "Speed Mode is On" message. This indicates that your data were selectively plotted. You can modify or disable Speed Mode settings. See, Speed Mode, Skip Points if Needed.
|
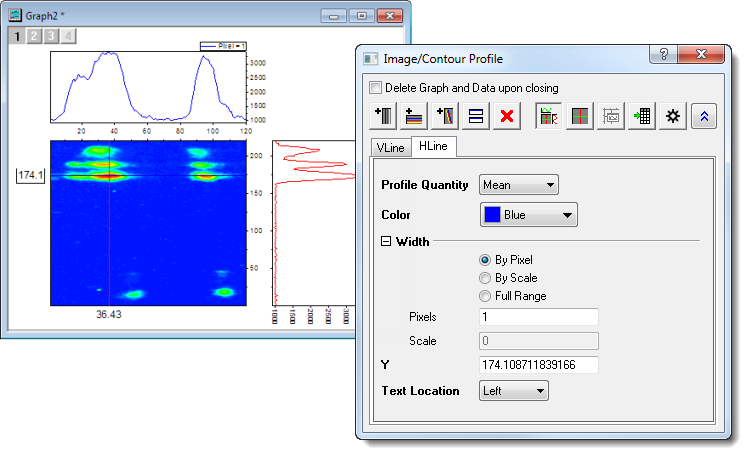
Image/Contour Profile Dialog Controls
The Image/Contour Profile dialog box opens when the Profile plot is created:
- Close the dialog box by clicking the
 button. button.
- Open the dialog box by clicking the
 button in the upper-right corner of the Profile graph page. button in the upper-right corner of the Profile graph page.
Toolbar Buttons

|
Specify whether to delete the profile graphs and data after the Image Profile dialog is closed.
|

|
Add a vertical profile line. Vertical profile lines are added to the graph layer to the right of the source plot.
|

|
Add a horizontal profile line. Horizontal profile lines are added to the graph layer above the source plot.
|

|
Add an arbitrary profile line. Arbitrary profile lines are added to the graph layer above and to the right of the source plot.
|

|
Places a movable, duplicate line at the position of the active profile.
|

|
Deletes the active profile. If the profile is the only one in the layer, the layer is simultaneously hidden (see below).
|

|
Arrange the profile plots and the source plot in a composite graph. Layers without data are not shown this mode.
|

|
A toggle that Extracts the profile plots to separate graph windows or recombines plots into a single composite.
|

|
This button is enabled only when the profile plots are plotted to separate graphs. When this button is clicked, the profile graph that corresponds to the active tab will become active.
|

|
Go to the profile dataset of the active tab.
|

|
This button opens the Default Settings dialog.
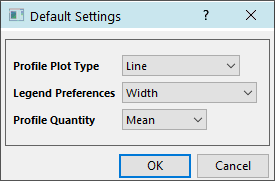
- Profile Plot Type: Change plot types for vertical, horizontal and arbitrary profiles. Options are line (default), scatter and line+symbol.
- Legend Preferences: Applies to current and future added profile plots. Choose the profile plot width, position value or profile line name to show in the legend. Profile Line Name will set Legend Custom Format to @LC.
- Profile Quantity: Choose default statistic used for Profile Quantity (see below).
|

|
Show VLine, HLine and ALine tab controls (see next).
|
Tab Controls
Tab controls differ slightly for matrix data and virtual matrix (worksheet) data. Differences are noted in the table.
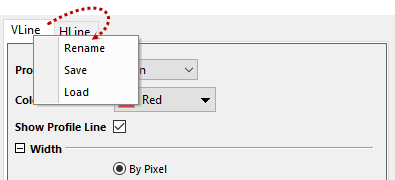
Context Menu
Right-click on the tab title to rename the tab, save the detailed line settings for future use, and load the pre-saved line settings for different graph window.
Detailed Controls
Customize current profile line.
| Profile Quantity
|
Choose a quantity to plot. When you are plotting along a single pixel (see Width setting, below), these values have no meaning (i.e Min=Max=Mean, etc). When you are profiling with a range of values, this setting will determine which quantity is plotted within the profiled range.
For example, you are profiling along VLine and you have set Width to By Scale and set scale to 20. This will place two vertical lines, centered at X and located at a distance of 20 scale units apart. The Profile Quantity will then be measured across the 20 scale units (between the two vertical lines), at the chosen X value.
- Min
- Max
- Mean
- Median
- Sum
- SD
|
| Output Profile Data
|
Only available when source data is from a virtual matrix.
- Same as Source
- Output profile data at same X/Y values as source data.
- Uniform Linear
- Output profile data at uniformly spaced X/Y values according to the X/Y range of source data.
|
| Color
|
Specify the color of profile lines.
|
| Show Profile Line
|
Specify whether to show the profile line.
|
| Width
|
Specify the width of sample profile.
- By Pixel
- Specify the width of the profile in pixels. Use the Pixels edit box to specify number of pixels.
- By Scale
- Specify the width of the profile by scale values. Use the Scale edit box to specify width in scale units.
- Full Range
- Use full range (X or Y ) as the width. Only available for vertical or horizontal lines.
- Pixels
- Use edit box to specify the width of the profile when by Pixel is selected. Units correspond to pixels in the data matrix. Note that the width of the arbitrary profile is fixed at 1 pixel.
- Scale
- Use edit box to specify the width of the profile in axis scale units, when By Scale is selected. Notice that the width of arbitrary profile is not visible (only a single line is displayed) but the Scale parameter will be accounted for in the calculated profile. The width of an arbitrary profile is calculated as
") 1/2, where 1/2, where  and and  are the projections of the lateral width along the X and Y axes, with respect to existing axis scales. are the projections of the lateral width along the X and Y axes, with respect to existing axis scales.
|
| X
|
Specify the position of the profile. This is available only when the profile is a vertical one and Full Range is not selected.
|
| Y
|
Specify the position of the profile. This is available only when the profile is a horizontal one and Full Range is not selected.
|
| X1, Y1, X2, Y2
|
These controls are available only when the profile is an arbitrary one. They control the position and length of the arbitrary profile. X1 and Y1 determines the X and Y location of one end of the line while X2 and Y2 determines the location of the other end.
|
| Text Location
|
A text label is displayed on the axis to show the position of the profile. Using the drop-down list, you can specify the position of this text label. Available options:
- Top
- On the top axis. (This is for vertical profiles.)
- Bottom
- On the bottom axis. (This is for vertical profiles.)
- Left
- On the left axis. (This is for horizontal profiles.)
- Right
- On the right axis. (This is for horizontal profiles.)
- None
- Apply to vertical and/or horizontal profiles. This may be especially useful when you wish to export the graph without visible labels.
|
Deleting Profiles and Hiding Layers
When you delete all profile lines from the layer using the Delete Active Profile button on the Image/Contour Profile, the layer is hidden (but not deleted).
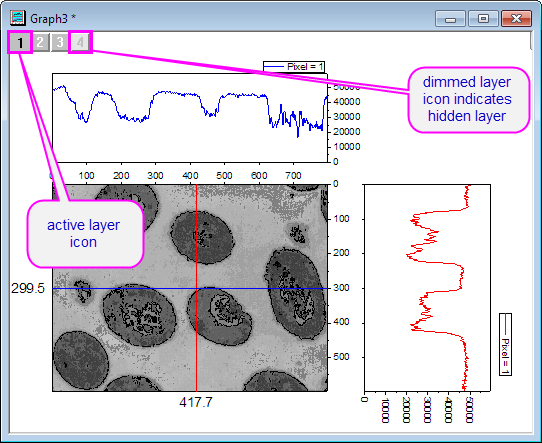
| Note: You can only hide the layer by deleting profiles with the Delete Active Profile button. If you select lines and press the Delete key, this only deletes the line. An empty graph layer remains.
|
Accessing Profile Data
- Each Profile plot will have its own workbook, with a worksheet for each profile (horizontal, vertical and arbitrary) that contains at least one profile line.
- Lines added to a profile will add columns in the corresponding sheet.
- Worksheet columns contain XY values of profile data for each profile line separately.
- Column values are dynamically updated as you change Width and X/Y settings.
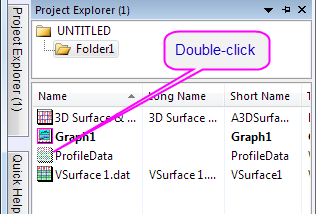
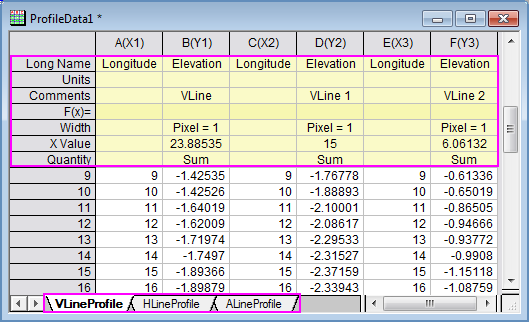
- Workbooks of profile data are hidden by default but you can view them by clicking the Go to Profile Data button on the Image/Contour Profile dialog toolbar. Alternately, you can locate the hidden workbook in Project Explorer and double-click on the dimmed window icon (named as ProfileDataN).
- Profile data sheets display column label row Long Name, Comments, Width, X or Y Value, and Quantity or Line, by default. Label row Comments, Width, X or Y Value and Quantity or Line display key parameters used to generate the profile data in each column. Label row Quantity shows in horizontal and vertical profile data, while Line shows the line function of the arbitrary profile line.
|