25.6.4 Use National Instruments™ LabVIEW™ as a client applicationLabVIEW-client-app
National Instruments™ LabVIEW™ is widely used for data collection. For example, many instrument and sensor vendors provide LabVIEW drivers for acquiring data. Once the data is collected, the end user will need to analyze the data and create reports for presentation. Origin provides powerful data analysis and graphing tools, including the Analysis Template feature which provides the means for performing repeat analysis on newly acquired data. The ability to communicate between LabVIEW and Origin can thus greatly improve the efficiency of data acquisition, and post-acquisition analysis and presentation.
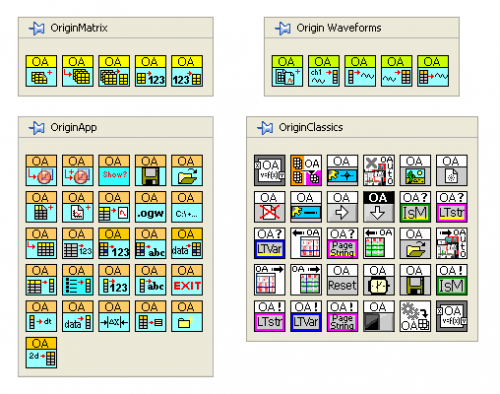
With this objective in view, we have provided a collection of LabVIEW sub-VIs (see images) that are shipped with Origin. LabVIEW users can then simply incorporate these custom sub-VIs in their main LabVIEW application to communicate seamlessly with Origin.
View National Instruments White Paper on Connecting LabVIEW with Origin.
For detailed information on the LabVIEW sub-VIs shipped with Origin, please see:.
Examples
1. Performing Fitting with Analysis Template
The figure below shows the block-diagram of a sample VI located in <Origin Program Folder>\Samples\COM Server and Client\LabVIEW\Analysis Template.vi.
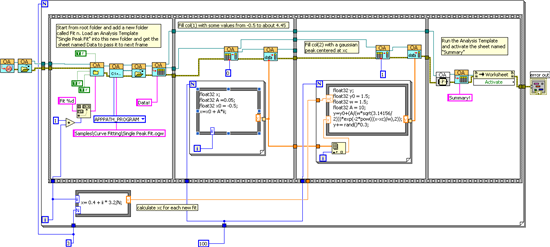
This sample VI demonstrates generating simulated data, loading an Analysis Template in the Origin workspace and then performing curve fitting. The above process is repeated three times but each time with a different set of simulated data.
The Analysis Template used in this example has five sheets, as shown below. The second sheet, Data, has two empty columns. When data is filled in these columns, non-linear curve fitting is automatically triggered, generating results in the report sheet and the custom report (the Summary sheet).
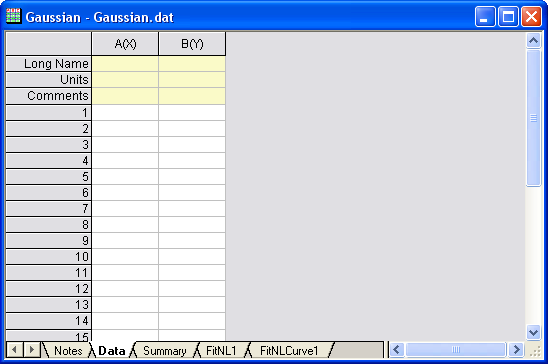
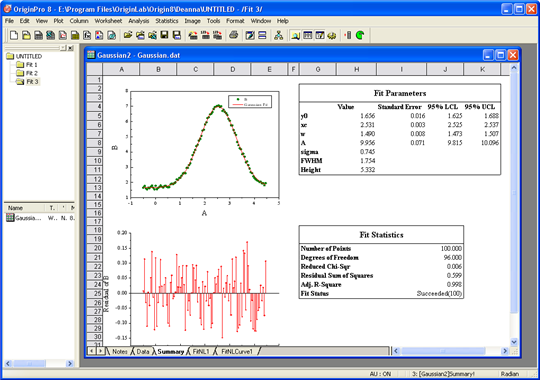
After running this example VI, you will see three folders in the Origin workspace. In each folder, there will be a workbook created from the above Analysis Template. The Summary sheet in the workbook will be filled with results calculated from the simulated data.
2. Using Origin to Complement LabVIEW™ DAQ Application
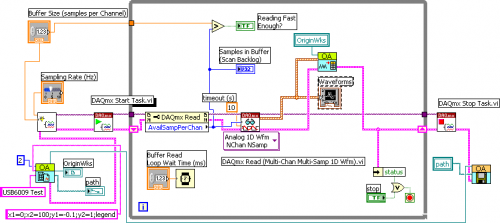
Sending data from LabVIEW to Origin is now very simple. In the simple DAQ VI below, only two Origin-specific sub-VIs are needed. The dynamic data output from any LabVIEW input source can be wired into an Origin sub-VI, just as simple as wiring that data to a LabVIEW graph object.
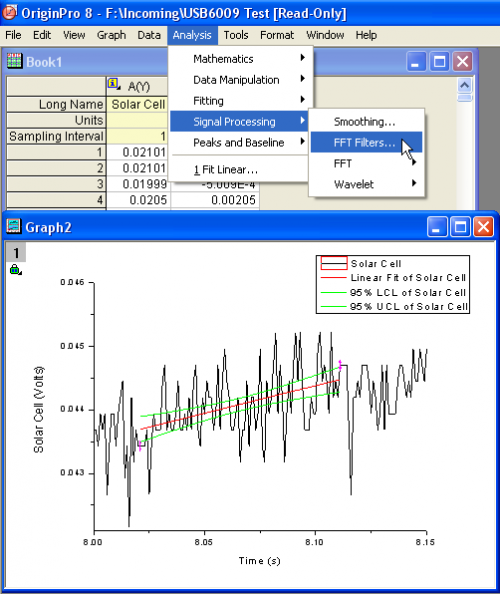
Post-processing data sent to Origin is easy since Origin has intuitive and interactive graph manipulation and analysis tools. As shown in the screenshot below, you can create a plot of the data, zoom into a region, and perform your desired analysis.
|