2.10.37 plotmyaxes
Menu Information
Plot : Multi-Curve : Multiple Y Axes...
Brief Information
Create a multi-Y axis plot
Additional Information
Minimum Origin Version Required: 8.1 SR0
The option to hide the graph is available starting with Origin 9.0.
Command Line Usage
1. plotmyaxes iy:=[Book1]Sheet1!((A,B),(A,C),(A,D),(A,E)) plottype:=scatter;
2. plotmyaxes iy:=Sheet1!((A,B),(A,C),(A,D),(A,E)) ly:=2 my:=1 axiscolor:=0;
3. plotmyaxes iy:=1!((1,2),(1,3),(4,5)) ry:=2 ytitle:=1 topx:=1 gap:=10;
4. plotmyaxes iy:=1!((1,2),(1,3),(1,4),(1,5)) plottype:=custom custom:="200 201" number:="1 2 1";
X-Function Execution Options
Please refer to the page for additional option switches when accessing the x-function from script
Variables
Display
Name
|
Variable
Name
|
I/O
and
Type
|
Default
Value
|
Description
|
| Input
|
iy
|
Input
XYRange
|
<active>
|
Specify the range that contains the data to be plotted.
|
| Plot Type
|
plottype
|
Input
int
|
0
|
Specify the plot type.
Option list:
- line:Line
- Line plot.
- scatter:Scatter
- Scatter plot.
- linesymb:Line+Symbol
- Line+Symbol plot.
- custom:Custom
- The plot types for the plots in each layer can be customized by the Custom variable.
- column:Column
- Column Plot.
|
| Plot Types in Each Layer
|
custom
|
Input
string
|
200
|
This variable is only available when the Plot Type is Custom. It specifies the plot types for the plots in each layer. Type the values that represent the desired plot types and separate them by space, embedded in double quotes. Click here to learn the values for the corresponding plot types.
Suppose the number of the specified plot types is n for a layer and the actual number of plots in the layer is m. If n is less than m, the first n plots will use the specified plot types and the remaining plots will use the plot type of the nth plot.
For example, “200 201” means the first data plot in the each layer is line while the rest of the data plots in the layer are scatter plots.
|
| Number of Left Y Axes
|
ly
|
Input
int
|
<auto>
|
Specify the number of Y axes on the left side. Can be auto-determined or set manually (e.g. plotmyaxes ly:=1;)
|
| Number of Right Y Axes
|
ry
|
Input
int
|
<auto>
|
Specify the number of Y axes on the right. Can be auto-determined or set manually (e.g. plotmyaxes ry:=1;)
|
| Add Middle Y Axis
|
my
|
Input
int
|
0
|
Specify whether or not to add a middle Y axis.
|
| Number of Plots in Each Layer
|
number
|
Input
int
|
1
|
Specify the number of plots in each layer. You can separate layer numbers for different layers by space (e.g plotmyaxes number:="1 4";).
|
| Link Axis Color to Plot
|
axiscolor
|
Input
int
|
1
|
Specify whether to link the color of axis to the corresponding plot. If this is set to 1, the axis and the corresponding plot will be of the same color.
|
| Show Y Title
|
ytitle
|
Input
int
|
0
|
Specify whether or not to show the title of each Y axis.
|
| Show Top X Axis
|
topx
|
Input
int
|
0
|
Specify whether or not to show the top X axis.
|
| Y Axes Gap (%)
|
gap
|
Input
double
|
<auto>
|
Specify the gap between Y axes. Enter a number l here. Then the gap between two adjacent Y axes will be equal to l percentage of the X axis width.
|
| Hide Newly Created Graph
|
hide
|
Input
int
|
0
|
Specify whether to hide the newly created graph. Note that this option is hidden in the dialog. One can only assign its value through Labtalk script.
|
Description
This X-Function provides a flexible way to create multi-Y graph with a shared X axis. The Y axes can be arranged at the two sides of the graph, along with one in the middle.
For more information, see Multiple Y Axes Graph in the Origin Help file.
Examples
- Import the file <Origin Directory>\Samples\Curve Fitting\Multiple Gaussians.dat to a new workbook.
- Highlight all the columns and select Plot > Multi-Panel/Axis: Multiple Y Axes... from the main menu to bring up the plotmyaxes dialog.
- Select Custom with the Plot Type drop-down list and type 200 203 in the Plot Type in Each Layer text box.
- In the Axis and Plot Assignment branch, check the Add Middle Y Axes check-box. Fill the Number of Plots in Each Layer with 1 2.
- check the Show Top X Axis check box in the Options branch. The dialog should look like this:
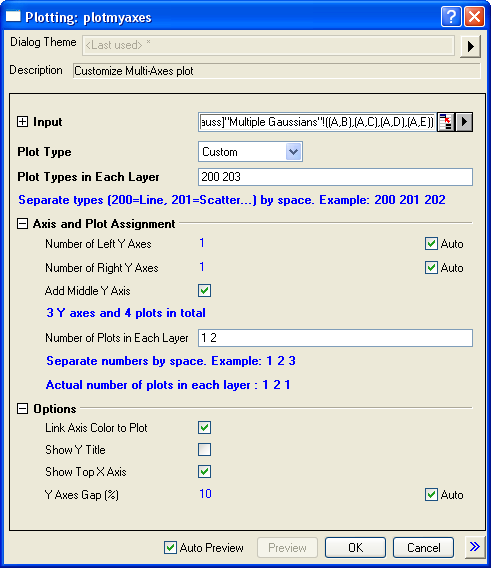
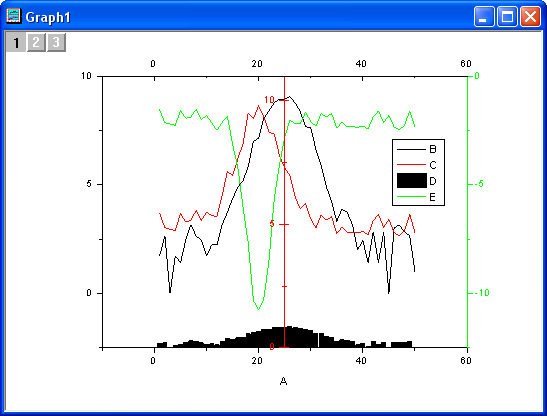
- Click the OK button to create a multiple Y axis graph.
Related X-Functions
plotxy
Keywords:double y, linked x
|