2.10.26 plot_windrose
Menu Information
Plot: Specialized : Wind Rose-Raw Data
Brief Information
Create a Windrose plot
Additional Information
Minimum Origin Version Required: 8.1 SR0
Command Line Usage
1. plot_windrose iy:=!3 labels:=0 subcount:=1;
2. plot_windrose -r 1 iy:=[Wind]Wind!(C"Power",B"Speed") labels:=1 ymin:=5 ymax:=10 yinc:=1;
X-Function Execution Options
Please refer to the page for additional option switches when accessing the x-function from script
Variables
Display
Name
|
Variable
Name
|
I/O
and
Type
|
Default
Value
|
Description
|
| Input
|
iy
|
Input
XYRange
|
<active>
|
Specify the input data range.
|
| From Minimum
|
xmin
|
Input
double
|
0
|
Not editable. It specifies the bin center of the minimum binning level of the wind direction. It is not accessible from dialog.
|
| To Maximum
|
xmax
|
Input
double
|
337.5
|
Not editable. It specifies the bin center of the maximum binning level of the wind direction. It is not accessible from dialog.
|
| Increment
|
xinc
|
Iuput
double
|
30
|
Not editable. It specifies the angle increment of the wind direction bins. It is not accessible from dialog.
|
| Number of Direction Sectors
|
xintervals
|
Input
int
|
16
|
The direction data will be divided into sectors and the counts of data points that fall into each sector will be used to create the windrose plot. This variable specifies the number of sectors for direction data.
|
| Direction Lables
|
labels
|
Input
int
|
2
|
Specify the direction labels shown on the windrose plot.
Option list:
- Show four direction labels: N, E, S, W.
- Show eight direction labels: N, NE, E, SE, S, SW, W, NW..
- Show sixteen direction labels: N, NNE, NE, ENE, E, ESE, SE, SSE, S, SSW, SW, WSW, W, WNW, NW, NNW.
|
| Spoke Style
|
spoke
|
Input
int
|
0
|
Specify the style of spoke
Option list:
- Use sector as spoke style.
- Use the beginning width of 1st sector as the width of 1st block. Note: When there is no calm circle, all paddles show as lines.
|
| Minimum Speed (Calm)
|
ymin
|
Input
double
|
<auto>
|
Specify the minimum binning level for wind speed.
|
| Maxmum Speed
|
ymax
|
Input
double
|
<auto>
|
Specify the maximum binning level for wind speed.
|
| Bins
|
ybinmode
|
Input
int
|
<auto>
|
Specify the binning method
Option list:
When set to Increment, then you can specify the increment (bin size) for the binning by yinc variable
When set to Intervals, then you can specify the specify bin ends value for the binning by yend variable
|
| Increment
|
yinc
|
Input
double
|
<auto>
|
Specify the increment (bin size).
|
| Bin Ends
|
yend
|
Input
string
|
<unassigned>
|
Specify the bin ends value
|
| Number of Intervals
|
yintervals
|
Input
int
|
<auto>
|
This is not editable. It displays the number of intervals used in the wind speed binning. This is calculated with the current values of Minimum Speed, Maximum Speed and Increment.
|
| Show Calm Circle
|
calm
|
Input
int
|
0
|
Specify whether to show the calm circle in the plot.
- Not show the calm circle
- Show the calm circle
|
| Orientation
|
orientation
|
Input
int
|
0
|
Specify the orientation of the wind directions.
Option list:
- 0=from: Direction (Blowing From)
- The directions where the wind blows from.
- 1=to: Flow Vector (Blowing To)
- The directions where the wind blows to.
|
| Quantity to Compute
|
stats
|
Input
int
|
0
|
Specify what to calculate for each bin.
- Compute and output the count of each bin.
- 1=freq: Percent Frequency
- Compute and output the percent frequency of each bin.
|
| Subtotal Count for Each Speed Interval
|
subcount
|
Input
int
|
0
|
Specify whether to output subtotal count/percent frequency (determined by stats) for each speed interval.
Option list:
Not output subtotal count
Output subtotal count
|
| Output Worksheet
|
rd
|
Output
ReportData
|
<new>
|
Specify how to output data in the worksheet.
|
Description
This X-Function is used to create wind rose plot for the raw wind direction and speed data. Firstly, wind direction-speed bins are created from the minumum value to the maximum value of both direction and speed, by a specified bin size. Then each bin is searched and the data points that fall into this bin are counted. If a value falls on the upper edge of the bin, it is included in the next higher bin. Finally, a wind rose is plotted by these 2D bins. Please refer to our User Guide here.
Examples
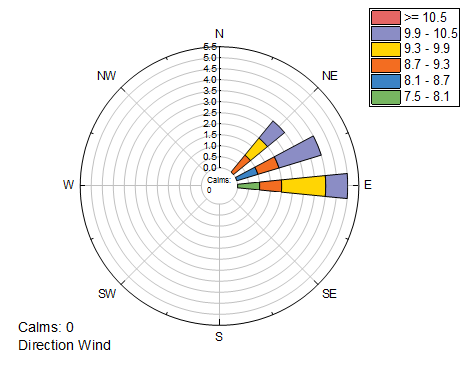
The following example creates a windrose from our sample data
doc -s;
doc -n;
newbook;

//import "Categorical Data.dat" file under "<Origin EXE Folder>\Samples\Graphing" path
string fn$=system.path.program$ + "Samples\Graphing\Wind.dat";
impASC fname:=fn$;

//creating windrose,
//col("power") as X range and col("power") as Y range
//Number of Direction Sectors = 16, Direction Labels = "N-NE-E..."
//Minimum Speed = 7.5, Maximum Speed = 10.5, Increment = 0.6
//Subtotal Count for Each Speed Interval is checked
plot_windrose iy:=(3,2) labels:=direct_8 ymin:=7.5 ymax:=10.5 yinc:=0.6 subcount:=1;
Note: in Origin 2017 or ealier versions, this X-Function is not accessible from LabTalk script. To plot windrose from script, you will need to use
worksheet -px
so in the example about, you will need to use:
worksheet -px ? WINDROSE plot_windrose iy:=(3,2) labels:=direct_8 ymin:=7.5 ymax:=10.5 yinc:=0.6 subcount:=1;
Related X-Functions
TwoDBinning
Keywords:wind direction, flow
|