2.10.6 plot_gboxindexed
Menu Information
Plot: 2D: Group Plot: Grouped Box Charts - Indexed Data
Brief Information
Create grouped box plot with indexed data
Additional Information
Minimum Origin Version Required: 9.1 SR0
Specifying a graph template is available starting with 2021b.
Command Line Usage
1. plot_gboxindexed -r 1 irng:=1!B"Machine" group:=1!A"ID" theme:=<Original>;
2. plot_gboxindexed irng:=[Book10]1!2 group:=[Book10]1!1 theme:="Box_Column Scatter";
3. plot_gboxindexed -r 1 group:=[Book1]nitrogen!A"plant" template:=C:\Users\shirley\Documents\OriginLab\UserFiles202002\MygBox.otpu theme:=Box_HalfBox;
X-Function Execution Options
Please refer to the page for additional option switches when accessing the x-function from script
Variables
Display
Name
|
Variable
Name
|
I/O
and
Type
|
Default
Value
|
Description
|
| Data Column(s)
|
irng
|
Input
Range
|
<active>
|
Specify the input data range.
|
| Group Column(s)
|
group
|
Input
Range
|
<unassigned>
|
Specify the grouping range.
|
| Graph Template
|
template
|
Input
int
|
<auto>
|
Specify a plot template to apply formats and settings on the graph. Auto means applying the default template gbox.optu; Uncheck Auto box to select a template file by clicking the ... button.
|
| Graph Theme
|
theme
|
Input
string
|
<unassigned>
|
Specify a built-in graph theme (e.g.theme:="Box_Column Scatter") If spaces in the name, must use quotes:
"Box_Column Scatter", "Box_Connect Mean Line", "Box_Dashed Whisker Thick Median", "Box_Data in Line", "Box_Filled Diamond", "Box_HalfBox", "Box_HalfViolin", "Box_I-shaped", "Box_Independent Line Colors", "Box_Interval Plot", "Box_Mean Bar with SE", Box_Violin, "Box_Whisker without Cap"
|
| Data Points Color by
|
color
|
Input
string
|
<optional>
|
Specifies the column that is used to customize data points color.
Note: The graph theme (Box Type) should plot with Data: "Box_Column Scatter", "Box_Data in Line", "Box_HalfBox", "Box_HalfViolin", "Box_Mean Bar with SE"
|
| Output Data
|
rd
|
Output
ReportData
|
[<input>]<new>
|
Specify the range to output the unstacked data.
|
Description
This X-Function creates a grouped box chart from indexed data. You can specify the input data range and grouping range, also apply a built-in graph theme for box chart.
Note: in Origin 2017 or ealier versions, this X-Function is not accessible from LabTalk script. To plot grouped box chart from script, you will need to use
worksheet -px
Below are some examples:
worksheet -px ? gbox plot_gboxindexed irng:=[Book1]Sheet1!(B,C) group:=[Book1]Sheet1!col(D);//Column B and C as input Y, column D as grouping range

worksheet -px ? gbox plot_gboxindexed group:=[Book1]Sheet1!(3,4) theme:="Box_I-shaped";//Active data range as input Y, the 3rd and 4th column as grouping range(s) with the built-in Box_I-shaped theme.
Note: Beginning with Origin 2018 SR0, an attention message warns the user when the number of groups exceeds some threshold value controlled by LabTalk System Variable @NC.
Examples
doc -s;
doc -n;
newbook;
//import "Categorical Data.dat" file under "<Origin EXE Folder>\Samples\Graphing" path
string fn$=system.path.program$ + "Samples\Graphing\Categorical Data.dat";
impASC fname:=fn$;
//with the imported worksheet activated, call the plot_gindexed x-function to create the grouped column plot from col(B),
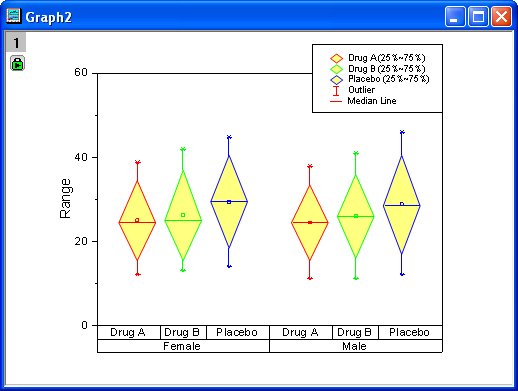
//with column C and D as the grouping ranges and the built-in theme "Box_Filled Diamond".
plot_gboxindexed irng:=[%H]1!col(B) group:=[%H]1!(C,D) theme:="Box_Filled Diamond";
Related X-Functions
plotgboxraw, legendbox
|