6.3.1 Merging and Arranging GraphsCustomize-Merge-Arrange-Graph
Summary
The Merge Graph Windows dialog allows you to select which graphs you wish to combine, choosing from any graph in the project. It also has controls to specify how you want the individual graphs arranged on the new page.
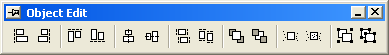
The Object Edit toolbar allows you to quickly align and size multiple layers.
The Layer Management dialog lets you add, arrange and link layers on a single graph page.
The Mini Toolbar(Since Origin 2020) lets you edit the graph elements more easily and interactively.
What you will learn
This tutorial will show you how to:
- Resize and align layers quickly
- Add a second axis using a nonlinear relationship with the primary axis
- Use Layer Management for more complex layer positioning and linking
- Merge multiple graphs into one graph
Aligning Layers using the Object Edit Toolbar
- Select File:Open and open the OPJ \Samples\Graphing\Layer Management.opj and go to the subfolder Arranging Layers. (If you don't see the subfolders, click View: Project Explorer to open the Origin Project Explorer window.)
- We want to use the Object Edit tools to rearrange the graph so make sure that this toolbar is visible. If it is not, you can open it from the View: Toolbars dialog box.
- On the graph, hold the Shift key down and click on all four layers to select them as a group. Press the Uniform Width
 and Uniform Height and Uniform Height  buttons on the Object Edit toolbar to apply a uniform height and width. Then click on the white space in the layer to deselect all graph layers. buttons on the Object Edit toolbar to apply a uniform height and width. Then click on the white space in the layer to deselect all graph layers.
- Hold Shift key to click and select the bottom two layers and then click the Bottom
 button on the Object Edit toolbar to align them. Click on the white space in the layer to deselect all graph layers. button on the Object Edit toolbar to align them. Click on the white space in the layer to deselect all graph layers.
- Hold Shift key to click and select the top two layers, then click the Top
 button to align them. Click on the white space in the layer to deselect all graph layers. button to align them. Click on the white space in the layer to deselect all graph layers.
- Click and select the top and bottom in the left column, and click the Left align
 . Click on the white space in the layer to deselect all graph layers. . Click on the white space in the layer to deselect all graph layers.
- Click and select the two in the right column and click the Right align
 button. button.
- Do not save changes to your project, as the same project will be used later to demonstrate the usage of Layer Management.
 | The Object Edit toolbar provides a quick way to align and resize layers. The first layer you select is the reference layer and all others are adjusted relative to the first-selected layer. The Layer Management tool provides additional options such as layer reordering and linking.
|
| Another way to select layers in a multiple layer graph is to press CTRL or SHIFT while clicking on the graph layer icons.
|
Displaying Opposite Axes with a Nonlinear Formula
An Origin 2D graph layer is a set of X, Y axes, and opposite axes can be turned on for both X and Y. In addition, the opposite axes can also display labels using any user-specified nonlinear formula with respect to the primary axis.
- Using the Project Explorer window, switch to the subfolder named Nonlinear Axis.
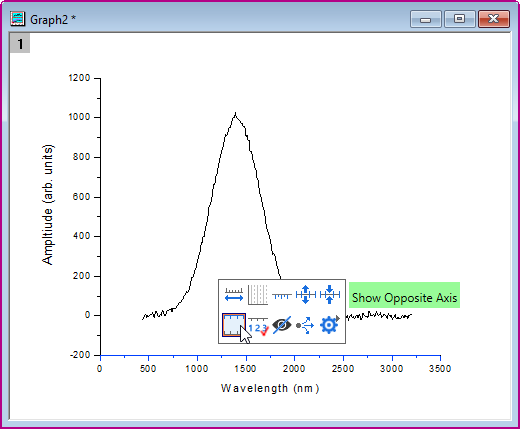
- Activate the graph window, click on the bottom X axis lines, the minitoolbar will pop up. Click the Show Opposite Axis button to show the top X axis.
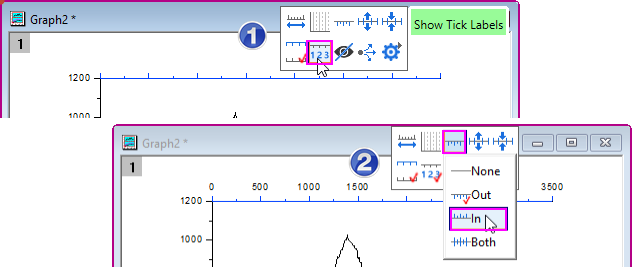
- Then, the top X will appear on the layer. Click on the axis line to expand the minitoolbar, click the Show Tick Labels button to show the axis labels and then click Tick Style button to set the tick to In.
- Double-click on the axis labels of top X axis to open the Tick Labels tab of Axis dialog. We want to display the labels on the top axis in units of Energy and the relationship between wavelength(bottom X) and energy(top X) is:
Energy (eV) = 1240/Wavelength (nm). So enter 1240/x in the Formula box.
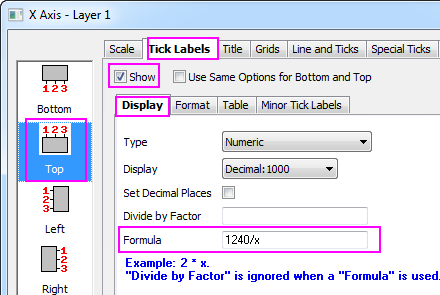
- Click OK button. The axis labels shows the correct relationship with bottom X.
| - If you are setting up a nonlinear relationship for the right Y-axis, in the Formula you still need to use x instead of y.
- You can also do similar settings in the Graph: Layer Management dialog to add such opposite axis:
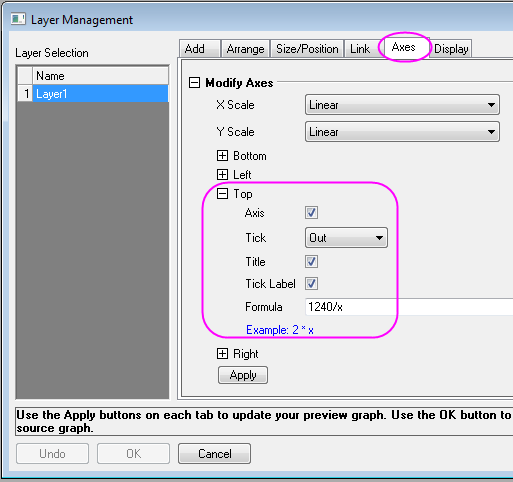
|
- Add a text object Energy (eV) as the top X-axis title (after creating this text object, right-click on it and choose Properties; then click the Programming tab and make sure that Attach to = Layer Frame).
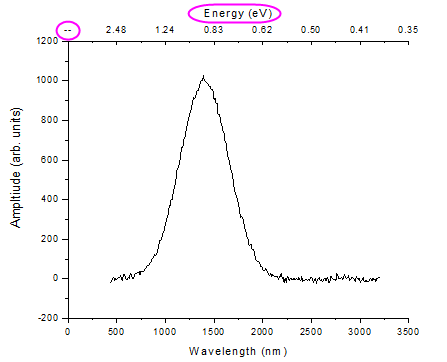
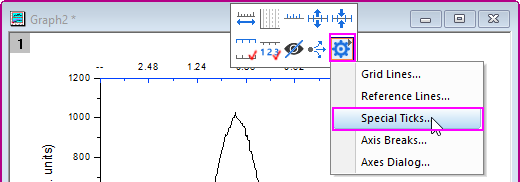
- In the above image, the first tick label of the top axis is a missing value for energy that corresponds to zero wavelength. To hide it, click on the top axis line to show up the mini toolbar, click the Axis Dialogs button to select Special Ticks from the context menu open the Special Ticks dialog.
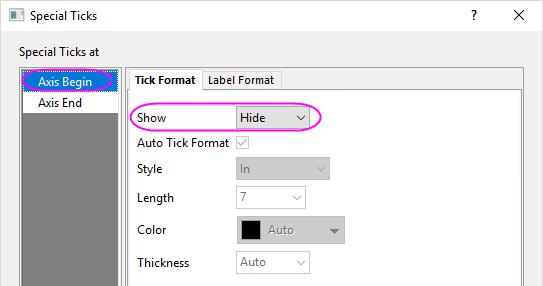
- In the opened dialog, select Axis Begin at the left panel and then select Hide for the Show drop-down list. Click OK to apply the settings and close the dialog.
Using Layer Management to Link and Position Layers
The Layer Management tool can be used to position, resize, swap, and link layers:
- Reopen the project \Samples\Graphing\Layer Management.opj and then switch to the subfolder named Arranging Layers. You can reopen the project by selecting File: Recent Projects: Layer Management.opj. Do not save changes to the project.
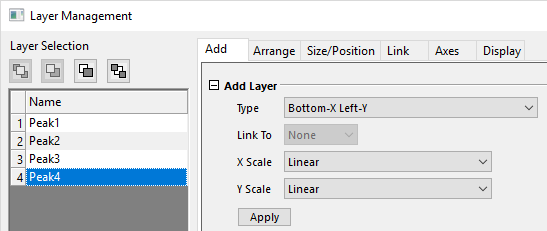
- Bring up the Layer Management tool from Graph: Layer Management. In the left panel, double-click on the name to rename the layers so that they are, top to bottom: Peak 1, Peak 2, Peak 3, Peak 4. The layer names now correspond to the legend for each layer.
- Now switch to the Arrange tab and do the following:
- Check Show Axes Frame.
- Set Horizontal Gap and Vertical Gap to 0.
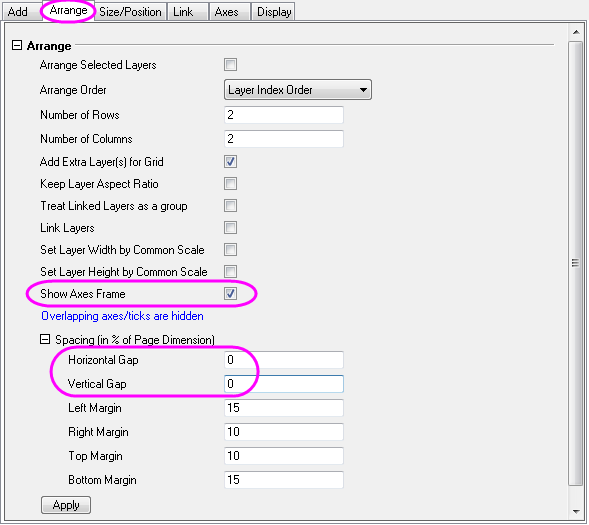
- Click Apply.
This resizes and repositions the layers so they are aligned, and hides ticks and labels where layers overlap.
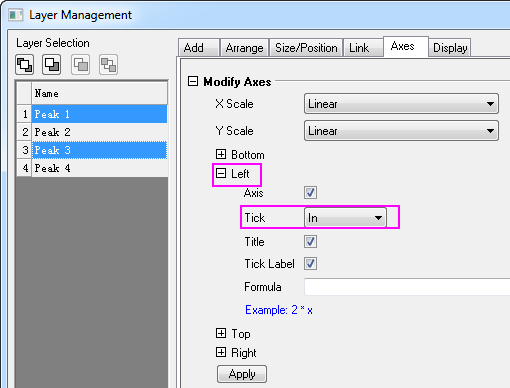
- Go to the Axes tab, hold down the CTRL key and select Peak 1 and 3 on left list, then expand the Left branch and set tick direction to In, and click Apply.
- Now select Peaks 3 and 4, set the Bottom tick direction to In and click Apply. Then select Peaks 1 and 2, set the Top ticks to In and click Apply.
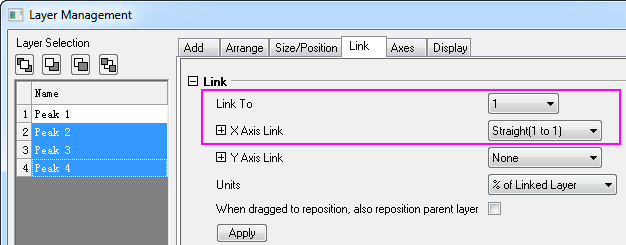
- Go to the Link tab and select Peaks 2, 3, and 4 in the left list and link them to layer 1, making sure you have the X-Axes linked Straight(1 to 1), and click Apply.
Click OK to close the dialog box.
- Click and select the top left layer, layer 1, then drag and resize the layer, then move the layer. Note that the child layers resize and move too, since they are dimensionally linked to layer 1.
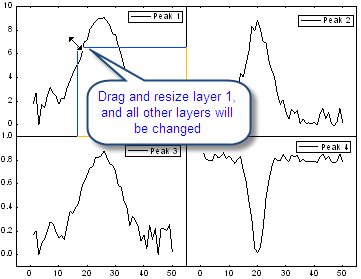
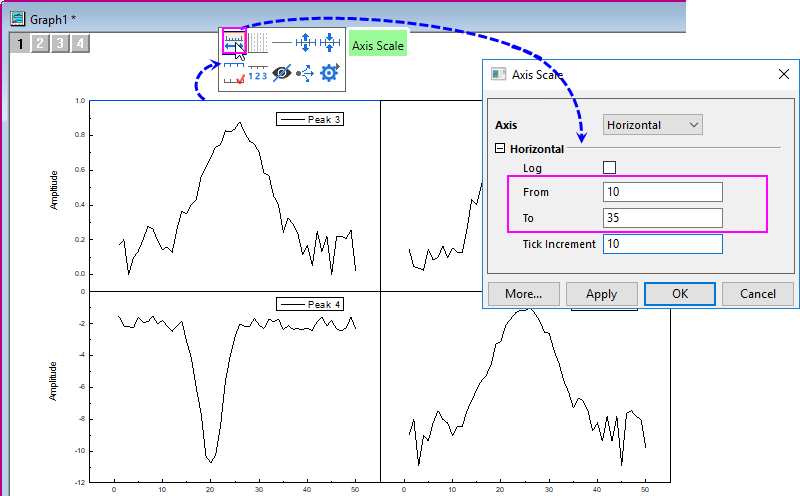
- Click on the Top axis of Layer 1, and then click the Axis Scale button in the mini toolbar, the Axis Scale dialog will be opened. Change the scale From 10 To 35, and click OK. You'll see that all the other layers now display the same X-axis scale range.
- With the graph active, choose Graph: Fix Scale Factors. This will reset all text labels on the page -- axis titles, tick labels, legend text -- to their true font size.
- Finally, using the Mini Toolbar Font Size drop-down, change axis tick labels and legend text to Font Size = 18. Change axis titles to Font Size = 22.
| If the layers are linked, they are treated as one unit. If you need to rearrange layers, you should first unlink them. You can re-link layers after arranging.
|
Merge Multiple Graphs
In this section, we merge two graphs from different subfolders of the same project while treating the four layers in one graph as a unit.
- Click on the Rescale button when the Graph 1 in the Arranging Layers subfolder is active.
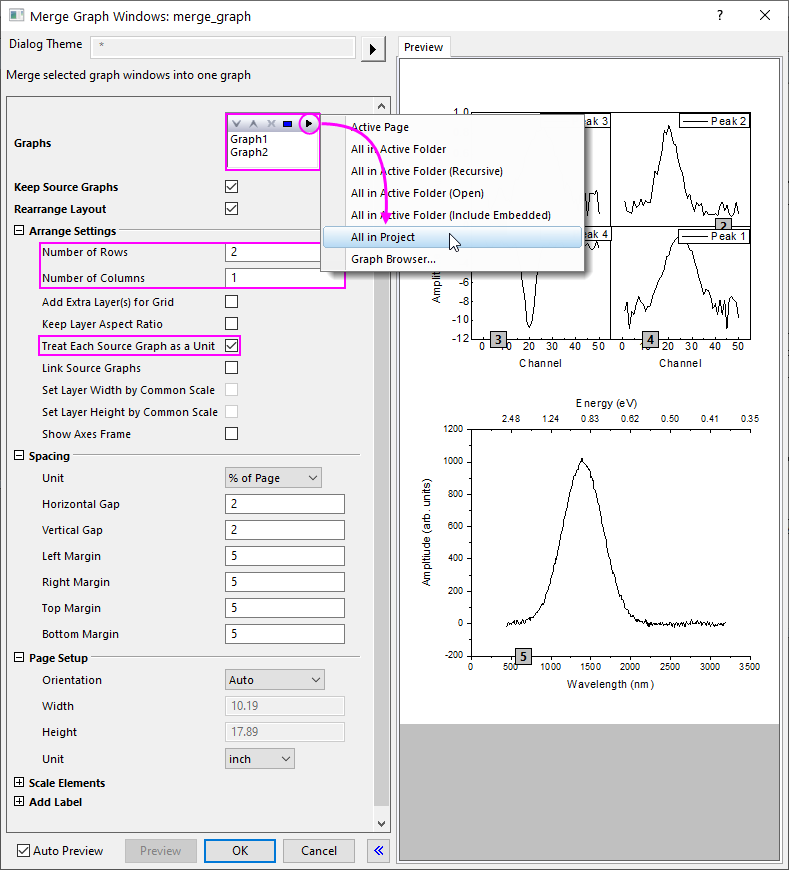
- Select Graph: Merge Graph Windows in the main menu to open the dialog.
- Do the following:
- Click the triangle button to the right of Graphs and from the flyout menu choose All in Project. Graph1 and Graph2 will show in the Preview panel (not shown).
- Make sure Number of Rows = 2 and Number of Columns = 1.
- Make sure Treat Each Source Graph As a Unit is selected.
| When Page Setup > Orientation = Auto, the final page size will be determined by the sum of the layer sizes plus margins/gaps and will therefore, be larger than the original page size. If you want to preserve the original page size, set Orientation = Landscape or Portrait and adjust gaps and margins, accordingly.
|
- Click OK to close the dialog box. A new merged graph page is created:

|