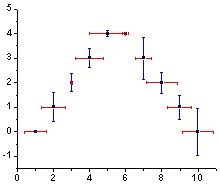
29.2.5 XY Error Bar GraphXY-ErrBar-Graph
Data Requirements
Select three Y columns or a range of data from three Y columns (columns may be multiples of three). The left-most Y column supplies the Y values, the middle column supplies the X error bar values and the rightmost column supplies the Y error bar values.
If there is an associated X column, X column supplies X values; otherwise, sampling interval of the Y column or row number is used.
Creating the Graph
Select required data.
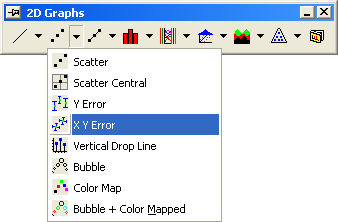
From the menu, select .
or
Click the XY Error button on the 2D Graphs toolbar.
Template
ERRBAR.OTP (installed to the Origin program folder).
Notes
There are multiple ways to add error bars to your graph (scatter, line + symbol, bar, etc.). This plot type assumes your data are in designated "Y" columns and it will work with any number of Y column triplets. If your error bar data are in columns designated as "yEr±", you do not need to choose this plot type but can instead choose from Line + Symbol, Column/Bar, etc. See Adding Error Bars to Your Graph.
Furthermore, if your data has multiple Y columns and every Y has its error column, but they share the same X column and X error, which are orgnized as follow
X - xErr - Y1 - yErr1 - Y2 - yErr2 - ... - Y# - yErr#
you can highlight all and choose Line + Symbol or other plot type to create an XYError bar graph. The xErr column that appears before any Y column will be used for each Y column that does not have its natural xErr column in the selection.
|