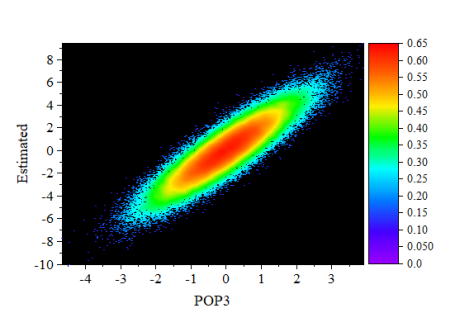
29.2.12 Density DotsDensity_Dots
Data Requirements
Select exactly one Y column or a range of data from one Y column. If there is an associated X column, X column supplies X values; otherwise, sampling interval of the Y column or row number is used.
Creating the Graph
- Select Y column data.
- From the menu, select .
Template
DensityDots.OTPU (installed to the Origin program folder).
Algorithm
For small data size, the exact estimation method is used to calculate kernel density.
For large data size (defined by system variable KDM, default value is 20,000), a fast algorithm is used to compute the density. First the 2D binned approximation is used to calculate kernel density for a set of 2D grid points (defined by system variable DCGS, default value is 151*151). Then 2D interpolation is applied to construct the corresponding density values for the original (x, y) points from density values of the grid.
Notes
This template is intended for plotting large numbers of scatter points, where the density of the points is of particular interest:
- Speed Mode is turned off, by default, so that density is accurately charted.
- The template uses a default filled square scatter symbol of size "0".
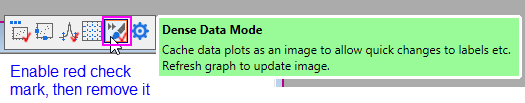
- For faster graph redraws, bitmap caching is turned on for this graph type. When caching is used, a prepared bitmap is resized and re-proportioned, as needed, when the window is resized or stretched. In some cases, this bitmap may become pixelated or distorted and if this is unacceptable, you can turn caching off by clicking the Dense Data Mode button on the page-level Mini Toolbar, twice (after the second click, there should not be a check-mark on the button).
- When the graph page is in Window View (default), contains a single layer and uses filled square symbols of size "0", a raster image will be placed on the clipboard when you choose Edit: Copy Page.
- Scatter points are mapped to a color scale using a calculated "proximity" factor for each plotted point. So, while the location of the point is determined by XY coordinates, the color assigned to that point is calculated using an algorithm. Color is not assigned based on relative magnitudes of the Y values.
- The template makes use of a special Density Color Mapping option on the By Points tab of the Color Chooser. As with any colormapped plot, you can manipulate the colormap itself via controls on the Colormap tab of Plot Details.
|