29.13.8 Stiff DiagramStiff-Diagram 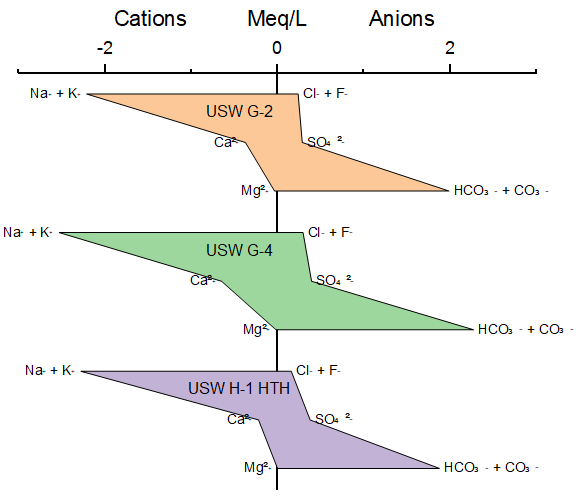
Data Requirements
A stiff diagram is a specialized graph type to display the major ion composition of a water sample.
Origin's stiff diagram is created from worksheet data with several Y columns:
- When there are 8 Y columns as input, they should be:
 ; ;
- When there are 7 Y columns as input, they should be:
 , by skipping , by skipping  ; ;
- When there are 6 Y columns as input, they should be:
 , by skipping , by skipping  . .
All these Y columns will be created as a polygon with 6 nodes: for more than 6 Y columns,  and and  will be combined nodes. will be combined nodes.
You are also allowed to select other more columns which can be treated as additional cations or additional anions input. And, once there are any additional inions, you have to select the column label row storing the conversion factors.
Creating the Graph
Highlight the source data and open the plotstiff dialog by either of the following:
- select Plot > Specialized: Stiff from top menu
The plotstiff Dialog Box
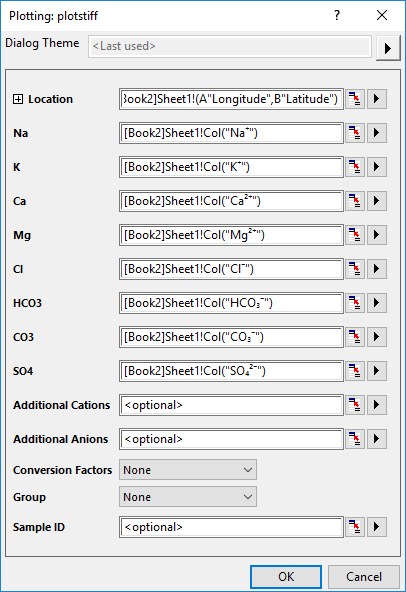
| Location
|
Specify the XY range to location the stiffs in a Stiff Map diagram. This option only show up when you select Plot > Specialized: Stiff Map from top menu.
|
| Ions
|
Specify the input ions: Na, K, Ca, Mg, Cl, HCO3, CO3, SO4. You are allowed to not specify CO3 or K and CO3. The unit of these input values are mg/L.
|
| Additional Ionic
|
Specify the additional ion, including Cations and Anions. The unit of these values are mg/L.
|
| Conversion Factors
|
Conversion Factors is equal to ionic charge divided by molecular weight. The unit is Meq/mg.
- This option could be None if there is no additional ion, that means all the input ionic data has been multiplied by built-in conversion factor automatically. The plot data will be in the unit "Meq/L";
- If there is any additional ion, you are supposed to select the column label row filled with conversion factors. Then the plot data should be in the unit "Meq/L" gotten by Input Ionic(mg/l)*Conversion Factors(Meq/mg).
|
| Group
|
Specify a column label row as group info for the ions. Select None means each column will be one point. If column A, B and F are one group, A and B are cations, F is anion, then A+B is one point in Cations and F is a point in Anions, and they are at same vertical position. If all 8 ions are selected to plot, and this control is set to None, Origin will use the system default grouping info, that is Na+K+Cl, Ca+HCO3+CO3 and Mg+SO4.
|
| Sample ID
|
You can select a column to specify the sample ID to label the polygons.
|
Template
Stiff.otpu (installed to the Origin program folder).
Controls
Once you have selected multiple columns and plotted a stiff diagram:
- Each row will make a polygon and all polygons will be arranged along with vertical axis. And, all cations will be plotted to the left side of the Y axis; all anions will be plotted to the right side of the Y axis
- No matter how many polygons in the graph, each polygon will be treated as one point of the plot, and you are not able to edit the 6 nodes of the polygons.
- All ions at same group will be plotted at same Y values, paralleling to X axis.
To customize a stiff diagram, you can open the Plot Details dialog and go to the tabs below:
|