29.11.4 Sankey MapSankey-Map
Data Requirements
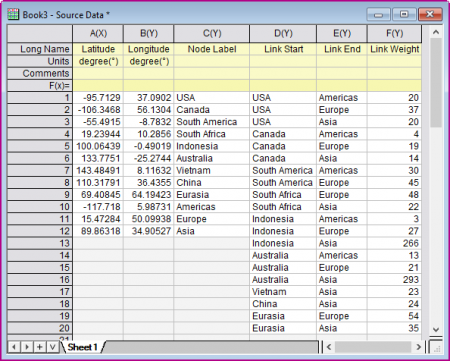
Select 6 columns at least, the column designation should be XYYYYY.
First 2 columns are used to definded the node position on the map; Third column is used to define the node lables; Fourth and Fifth column are used to define the link by node lables from 3rd column, or 0-based index of source and target nodes. Sixth column is used to define the weight of the links.
Creating the Graph
- Select required data.
- Select Plot > Categorical: Sankey Map.
For information on the customizing allivial diagrams, see these topics:
Template
sankeyMap.otpu (installed to the EXE folder of Origin)
Notes
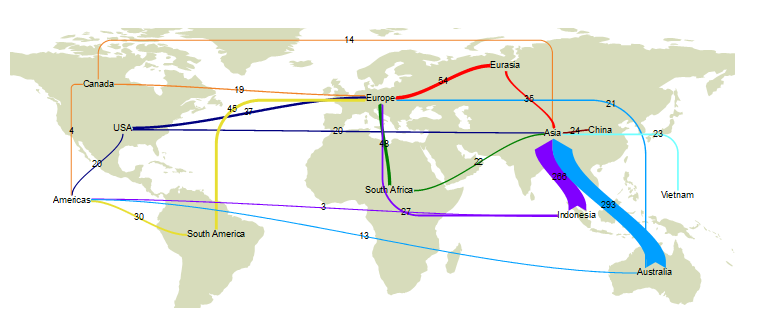
Sankey Map is an enhanced variety of Sankey diagram,which positions the nodes with map coordinates on a map.
You can show or hide nodes in whole or in part with the Show drop-down list in Node tab of Plot Details dialog. Once you selected to show the nodes, the nodes will be shown as bubbles by default; Furthermore, you are also allowed to select Show In&Out Pie Chart for Node to show the nodes as pie charts.
For this kind of Sankey on map, Origin supports to add links from/to any side of the nodes which are shown as bubbles. By default, a link from node A to node B need to calculate horizontal and vertical distance between node center:
- if delta_h>=delta_v, then the link input and output should be in horizontal direction, and connect between neighbor side.
- if delta_h<delta_v, then the link input and output should be in vertical direction, and connect between neighbor side.
For a link special point(double-clicking on a link with CTRL pressed), you are allowed to specify which side of node two ends should link to.
|