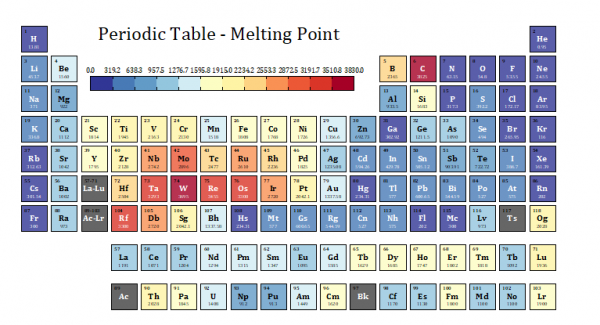
29.11.3 Tile Grid MapTile-Grid-Map
Data Requirements
Fill Only: XYY or XYYY columns.
X and Y columns are used to locate the cells; second Y column is used to color map the cells; third Y column is optional and sued to label the cells.
Base Graph: A general 2D graph as base graph, a worksheet with multiple groups of plotting columns and information column label rows(or columns).
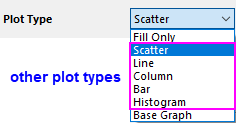
Other Plot Types:A worksheet with multiple groups of plotting columns and information column label rows(or columns).
Creating the Graph
Select required data.
From the menu, choose .
The X-Function dialog plottilemap will be opened to let you plot a fill-only or multi-layer tile gird map.
Fill Cells Only(One Layer)
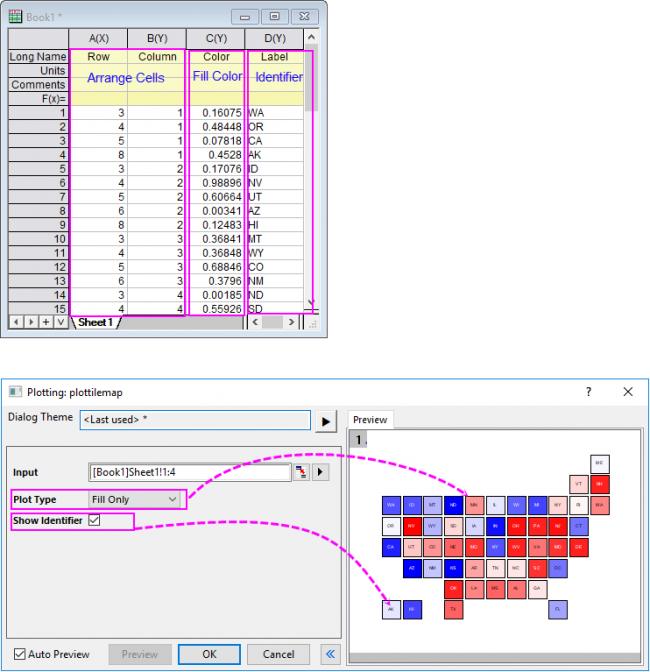
When you select Fill Only as Plot Type, the first two columns will be plotted as scatter plot, with black border and colormap fill. The fill color is decided by the third column. If the forth column is selected, its values will be treated as cell labels/identifiers.
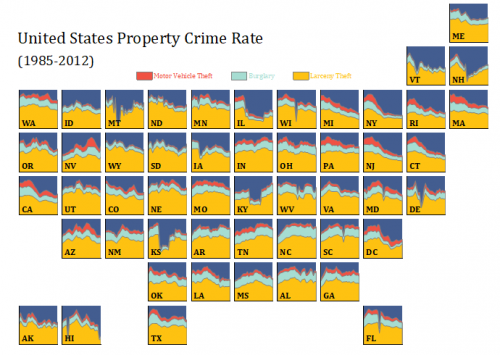
Cells With Plot(Multiple Layers)
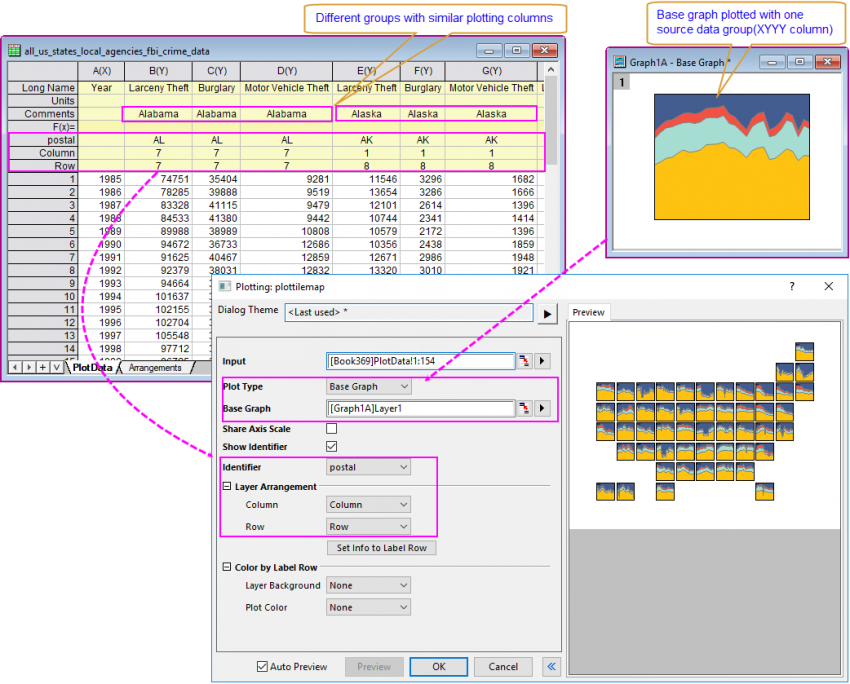
If you select another option(except Fill Only) under Plot Type, you will plot a multi-layer tile grid map, different from the Fill-only tile grid map:
- When you select Base Graph as Plot Type, you have to select an existing graph layer as the template to plot other grouped data as similar graph layers, arrange these layers by Row and Column values.
- When you selected other plot types, such as Scatter, you don't need prepare a graph layer in advance, all grouped data will be plotted as similar scatter plots and arranged by Row and Column values.
You can also use the controls in Color by Label Row group to specify the layer backgroud color and plot color with column label row values.
Set Information Columns to Label Row
Besides selecting existing column label rows for Column, Row and Color options, you can also use Set Info to Label Row tool to select worksheet columns, set them to column label rows and use these newly-created column label rows to arrange and color the graph layers:
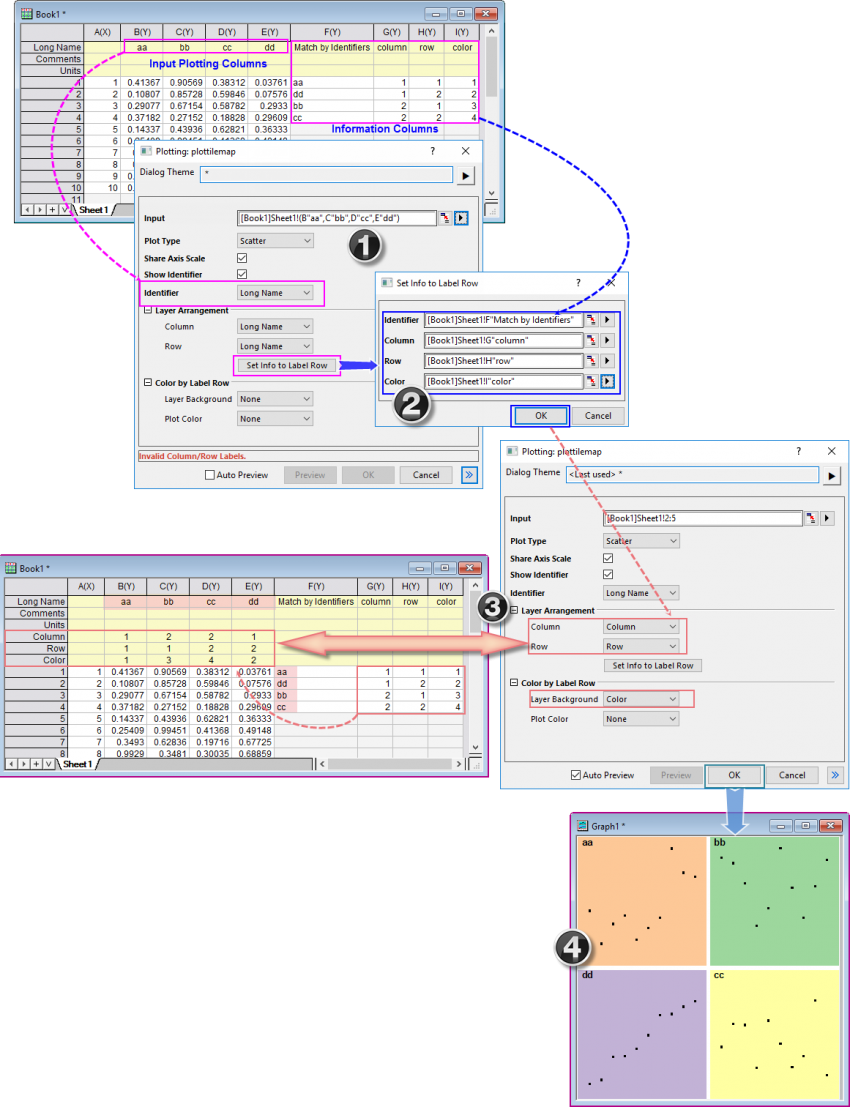
- Firstly, besides the Input plotting columns, prepare these information columns: Ordered Identifiers, column order, row order and background color(optional). In the plottilemap dialog, select the identifier label row("Long Name" in this case) for Idenfitifier option; Click Set Info to Label Row button to open the mini Set Info to Label Row dialog.
- In Set Info to Label Row dialog, select the ordered indentifier column for Identifier. This column is used to order the rows of the information columns when set them to label row. Select the column "column","row" and "color" for Column, Row and Color options. Click OK button.
- In the source worksheet, the values in the information columns has been transposed and inserted as column label row Column,Row and Color. Their values has been matched and re-ordered with the identifiers in Col(F) and "Long Name" of Col(B)~Col(E). And in the plottilemap dialog, these newly-created label rows is selected automatically. If the source worksheet already had column label rows named as "Column","Row" and "Color", newly-created label rows could be "Column1","Row1" and "Color1" and so on.
- Click OK to plot the tile grid map. You will see the four input plotting columns has been plotted as four layers and the layers has been arranged and colored according to the information columns.
Template
Fill Only: TileGridFillOnly.OTPU (installed to the Origin program folder).
Base Graph: Use the base graph layer as template.
Other Plot Types: Use the built-in template(such as Scatter.otpu) to plot the layer cells.
Notes
If you want to plot multi-layer tile map, we strongly recommend using Base Graph as Plot Type, as once you prepared the base graph layer in advance with desired plot and layer styles, all graph layers(cells) of the tile grid map will have these styles directly.
- For Fill Only tile grid map, all scatters are square and filled with different colors specified with the color column.
- For multi-layer tile gird map, all layers are square too, horizontal gap and vertical gap could be 1% of minimum of layer width and layer height. And, all layers share layer properties, axis scale, axis scale, plot properties. Selecting Show Identifier option will show identifiers in the layers' title with same position for all layers. You are always allowed to adjust the plot colors in same layers with the By Plots tab under Color Chooser even there are only one plot in each layer.
Version Information
| Minimum Version: Origin 2024
|
|