29.13.7 Durov DiagramDurov-Diagram 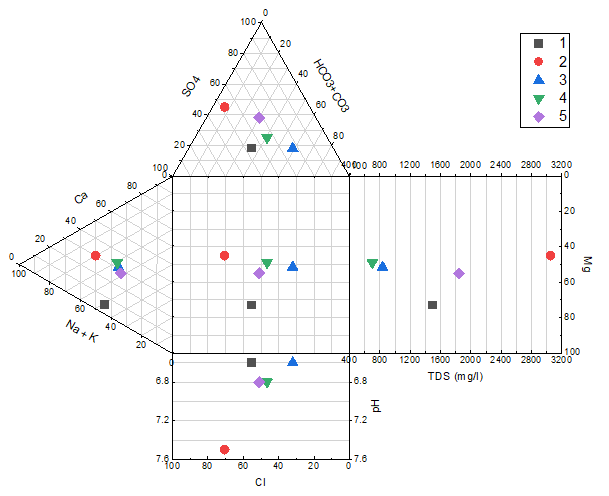
Data Requirements
Durov Diagram is an alternative to the Piper Diagram, which is also a specialized graph type for charting the chemistry of a water samples. Durov Diagram is based on the percentage of major ion milliequivalents in sample waters.
The Cations and Anions values are plotted on two separate triangular panels and the data points are projected onto a square grid at the base of each triangle. In addition, Durov Diagram allows to directly compare two other groundwater parameters, pH and the total dissolved solids (TDS).
Origin's durov diagram is created from worksheet data with multiple columns. Each column contains the percentage value of each ion group. Column order is critical and should be:  . The percentage value of each cation group is calculated based on the total concentration of calcium, magnesium, and sodium plus potassium cations; The percentage of each anion group is based on the total concentration of sulfate, chloride, and carbonate plus hydrogen carbonate anions. . The percentage value of each cation group is calculated based on the total concentration of calcium, magnesium, and sodium plus potassium cations; The percentage of each anion group is based on the total concentration of sulfate, chloride, and carbonate plus hydrogen carbonate anions.
Creating the Graph
Highlight the source data and open the plot_durov dialog by either of the following:
- select Plot > Specialized: Durov from top menu
The plot_durov Dialog Box
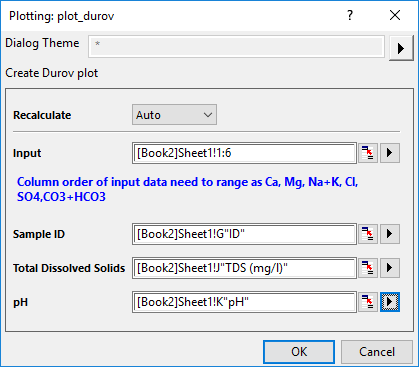
| Recalculate
|
Controls recalculation of analysis results
For more information, see: Recalculating Analysis Results
|
| Input
|
Specify the input data range.Column order Need to range as Ca, Mg, Na+K, Cl, SO4, CO3+HCO3.
|
| Sample ID
|
Specify the column used for the sample ID. This column will be used as the symbol color and shape indexing column in the durov plot, and this column will supply labels in the point by point legend.
|
| Total Dissolved Solids
|
Specify the data range for the amount of total dissolved solid. This column will be used to plot against Mg ion.
|
| pH
|
Specify the column which stores the pH values of water samples.
|
Template
Durov.otpu (installed to the Origin program folder).
Controls
Three worksheet templates are provided to convert the original concentration data to percentage values(normalize 1~100) and organize them according to data requirements for durov plot.
- By default, all sideward layers are linked to the parent layer "Layer1", the square panel in the middle, if you want to reposition any child layers, you can go to the Link Axes Scales tab of Plot Details to break the link and move the layer.
- If you don't want to break the link between layers, you can open the Layer Properties dialog by Format: Layer menu item and go to the Size/Speed tab for parent and change the value in the Left or Top text box.
For the bottom and left rectangle panel, Cl vs. pH and TDS(mg/L) vs. Mg, you can optionally do not draw them without setting Total Dissolved Solids and pH item in the plotdurov dialog box.
A user-defined dataset can be used to index the color/shape/interior of the symbols in the piper chart. You can also customize the increment list of color, shape and interior in the Increment Editor, Shape List and Interior List tabs in the Plot Details dialog.
|