17.2.10 Bland-Altman PlotsBland-Altman-Plots
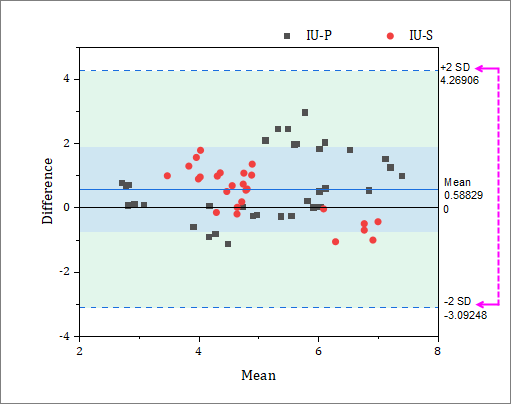
Bland-Altman plots (aka Tukey mean-difference plots) compare the results of two assays. To create a Bland-Altman plot in Origin, you should have two worksheet columns of values for each subject. A grouping column for subjects is optional. Most commonly, the mean of each value-pair is plotted on the X axis against the difference of each value pair on the Y axis. Two assays are considered to be in agreement if 95% of XY scatter points fall within some predetermined interval, something that Bland and Altman termed the "limits of agreement" (the authors suggested an interval of ±2SD of the mean difference).
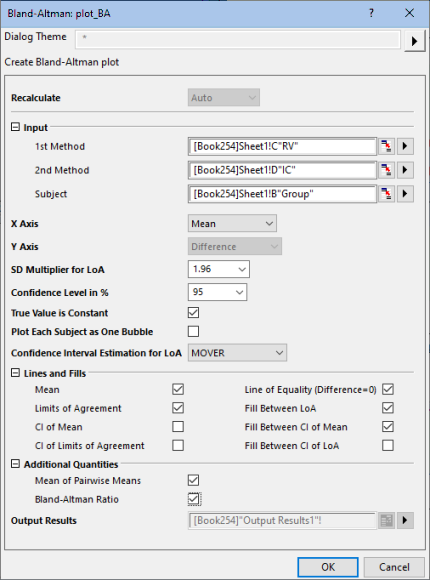
Analysis settings and statistics are chosen in the plot_BA dialog box and algorithms for calculations are documented here.
Input
1st Method/2nd Method
Use range controls to designate two columns (or a range of two columns) as the two methods that you want to compare (1st Method, 2nd Method).
For help with input controls, see Specifying Input Data.
Subject
When a grouping column (Subject) is used, the mean difference is the mean of within-group differences. When no Subject is specified, the mean difference is the mean of all value-pair differences.
X Axis
| Option
|
Description
|
| Mean
|
The arithmetic mean
|
| 1st Method
|
When 1st method is considered a "reference" method
|
| 2nd Method
|
When 2nd method is considered a "reference" method
|
| Geometric
|
The geometric mean
|
Y Axis
In addition to unit difference, one can plot percent difference or ratio on the Y axis.
| Option
|
Description
|
| Difference %
|
Percentage Differences of the value pairs are plotted on the Y axis ((difference of value pairs divided by average of value pairs) x 100). This is a good option when variability increases as values increase.
|
| Difference
|
Unit differences of the value pairs are plotted on the Y axis.
|
| Ratio
|
Ratios of the value pairs are plotted on the Y axis. This is a good option when variability increases as values increase.
|
SD Multiplier for LoA
Multiplier for Limits of Agreement. Default is 1.96. Choose 1, 1.645, 1.96, 2, 2.576, or 3.
Confidence Level in %
Default is 95. Choose 90, 95, 97.5 or 99.
True Value is Constant
Available when Subject is specified. Check this box when you are making repeat measurements on a fixed quantity (as opposed to paired measurements by two methods on a changing quantity).
Plot Each Subject as One Bubble
Available when Subject is specified. Each subject is grouped and bubble is located as Mean of group (X) and Mean Difference (Y). Bubble size is proportional to the number of replicates.
Mean Difference (bias) Estimation
Available when Subject is specified and True Value is Constant is not enabled (the measured value is not considered to be constant).
As outlined in Bland and Altman (2007), when estimating the mean difference and standard deviation of differences about the mean, we estimate variances (a) for repeated measures for the two methods on the same subject (Individual Row) or (b) between means of the two methods across subjects (Subject Difference).
Confidence Interval Estimation for LoA
There are two methods for estimating the CI for limits of agreement (LoA):
- Delta Method
- Method of Variance Estimates Recovery (MOVER)
Lines and Fills
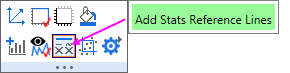
These graph elements are customized via the Reference Lines dialog box. To open the dialog, click inside the graph layer (but not on plotted data) and on the Mini Toolbar, click the Add Stats Reference Lines button and choose More....
For information on statistics and algorithms, see documentation for the plot_BA dialog box.
Additional Quantities
Additional quantities reported as Output Results:
| Option
|
Description
|
| Mean of Pairwise Means (MPM)
|
On the Output Results sheet, the mean of all values in column Mean.
|
| Bland-Altman Ratio
|
Calculated as 0.5*(upper LoA - lower LoA)/MPM
|
Output Results
Where output is sent. Default [<input>]<new> will create a new sheet in the source workbook. Click the flyout button for alternatives.
For more information, see Output Results > Specifying Your Output.
References
- Statistical Methods for Assessing Agreement between Two Methods of Clinical Measurement. J. Martin Bland and Douglas G. Altman. 1986.
- Agreement Between Methods of Measurement with Multiple Observations Per Individual. J. Martin Bland and Douglas G. Altman. 2007.
- Understanding Bland Altman Analysis, D. Giavarina. 2015.
- Reporting Standards for a Bland–Altman Agreement Analysis: A Review of Methodological Reviews, O. Gerke. 2020.
- Agreement of Two Different Methods for Measurement of Heart Rate Variability, Martin Radespiel-Tröger et. al. 2003.
|