6.11.4 Polar Graph with Custom Radial Axespolar-custom-radial
Summary
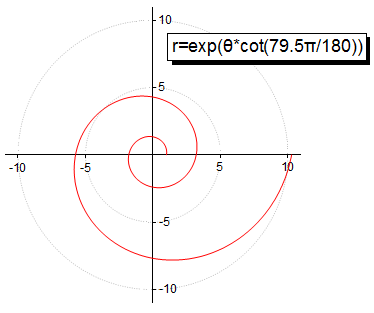
Origin's polar axis dialog allows for flexible customization of both angular and radial axes.
Minimum Origin Version Required: 2015 SR0
What You Will Learn
This tutorial will show you how to:
- create a polar graph
- hide angular axis
- customize radial axis
Steps
This tutorial is associated with <Origin EXE Folder>\Samples\Tutorial Data.opj.
Create a Polar without Angular Axis
- Open the Tutorial Data.opj file and browse to the Custom Radial Axis folder and activate workbook Book1E.
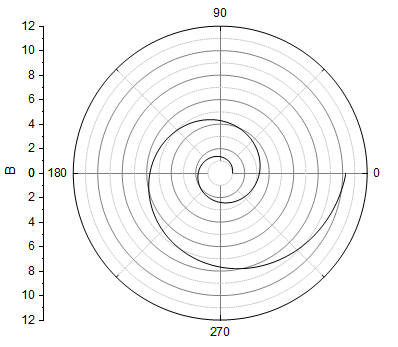
- Highlight column B and select Plot > Specialized : Polar theta(X) r(Y) to generate a polar graph.
- Select the legend object and delete it.
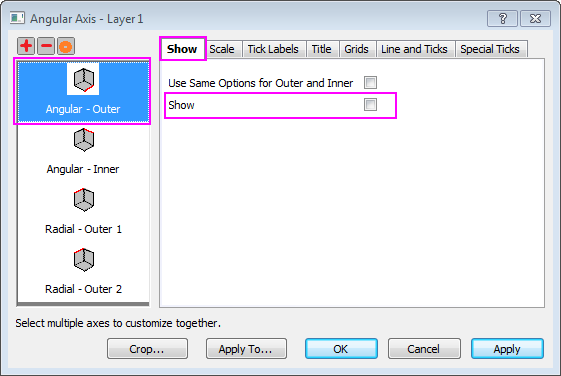
- To hide the Outer axis (the outer circle) of the polar graph, double-click on any axis to open the Axis dialog. Go to Show tab, select Angular -Outer in the left panel, and clear Show check box.
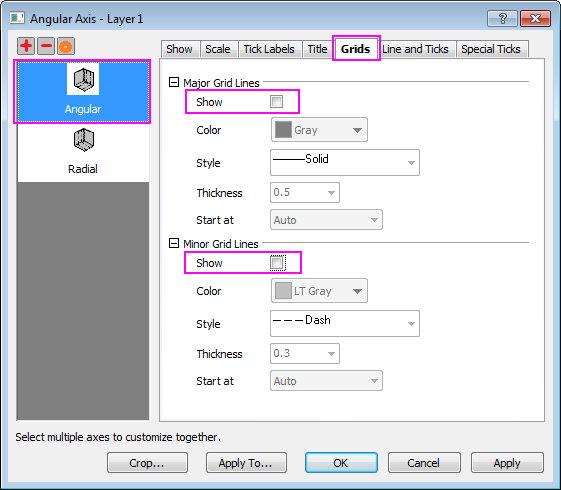
- To hide all angular grid lines, go to Grids tab and make sure Angular is selected in the left panel. Clear the Show check boxes under Major Grid Lines and Minor Grid Lines section.
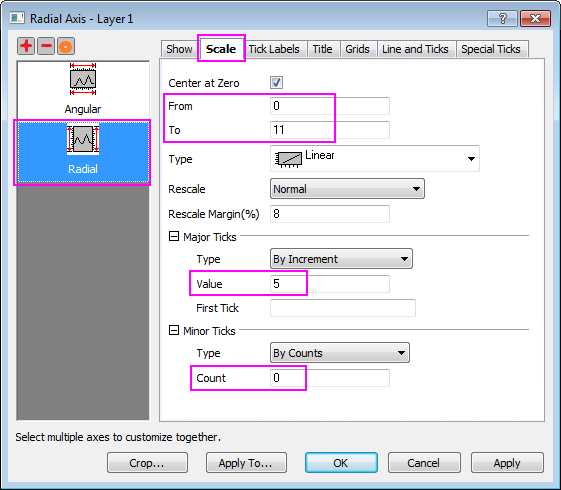
- Go to Scale tab and select Radial in the left panel. Set the axis scale as shown below:
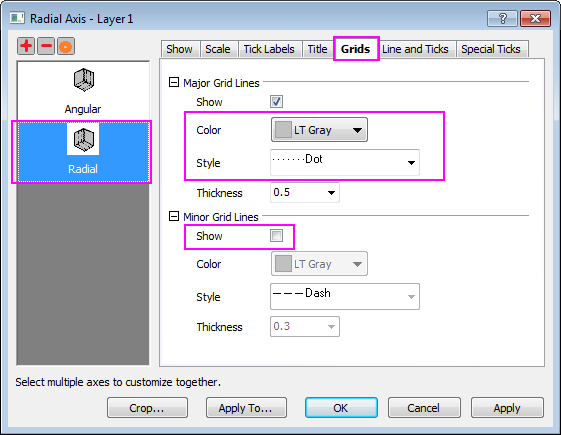
- Go to the Grids tab and set as below:
Add Radial Axis on each Major Tick
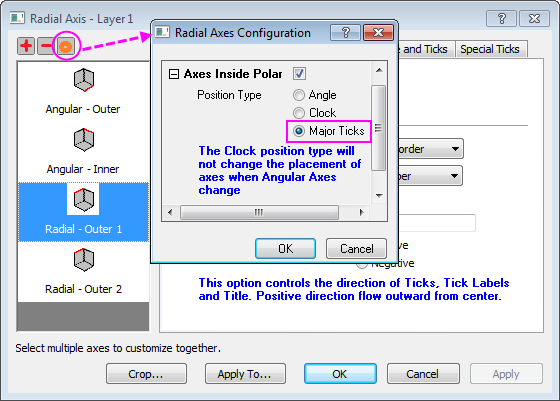
- To show radial axis on each major tick position of angular axis, click the 'Radial Axes Configuration button to open the dialog. In the dialog, check the Major Ticks option under the Axes Inside Polar section.
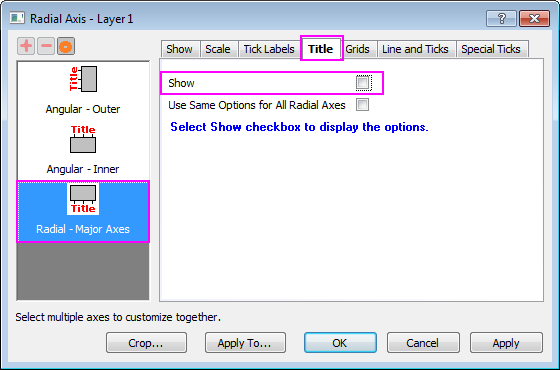
- To hide axis titles, go to Title tab and choose Radial - Major Axes in the left panel. Uncheck the Show check box. Click Apply button.
- There are 4 0's show in center of polar. To hide them, go to the Special Ticks tab. Select Hide from the Axis Begin drop-down list.
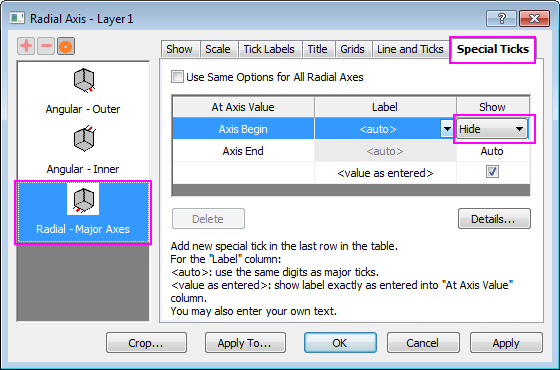
Click OK to close the dialog.
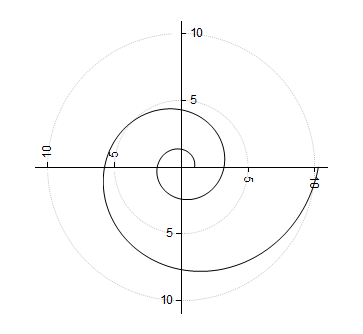
When radial axis is set to show on each major ticks, if you go to Scale tab of Radial and change major ticks, the radial axis will show in new major tick positions.
Use Configuration Dialog to Customize Radial Axis
Origin supports two kinds of radial axes. One is the frame border kind of axis around the polar graph. The other is inner axis from center of polar outwards.
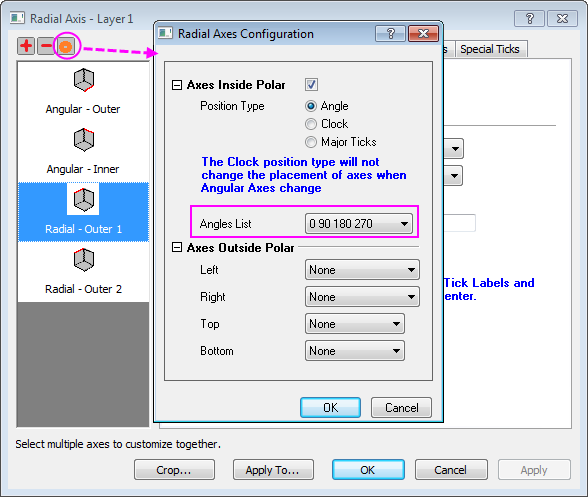
- Continue with the graph from the previous section, click on the Radial Axes Configuration button on the top of left panel. In Radial Axes Configuration dialog, under Axes Inside Polar branch, set Angles List as below, and click OK to close dialog.
- Click Apply button. Four four radial inner axes show in the left panel.
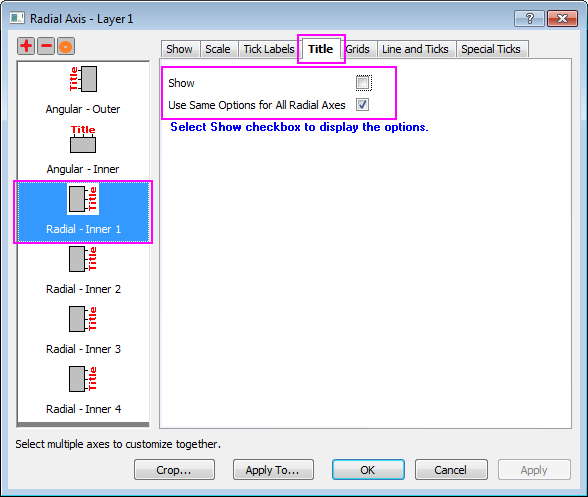
- Go to Title tab, select Radial - Inner Axis1 in the left panel. Then check Use Same Options for All Radial Axes check box and clear the Show check box to hide all the titles. Then this setting will be applied to four radial axes.
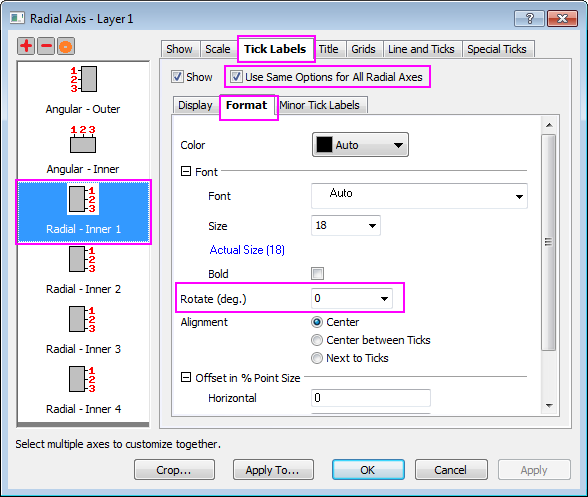
- Go to Tick labels node and check Use Same Options for All Radial Axes. Under Format subtab, set Rotate(dge.) to be 0.
- Go to the Special Ticks tab, and click Use Same Options for All Radial Axes check box. Set Axis Begin to Hide.
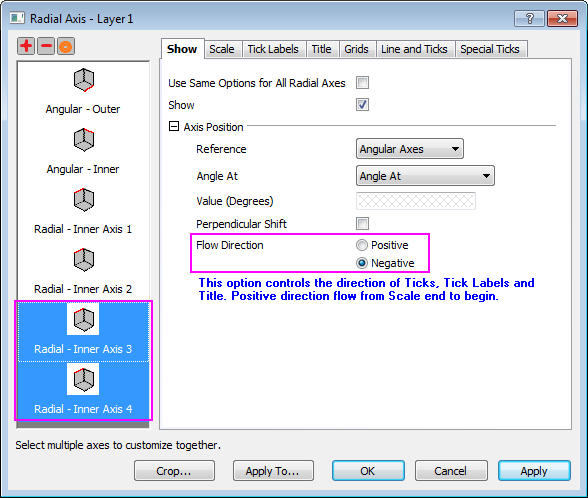
- Go to Show tab, press Shift key to select Radial - Inner Axis 3 and Radial - Inner Axis 4 two axes, change Flow Direction to Negative under Axis Position section.
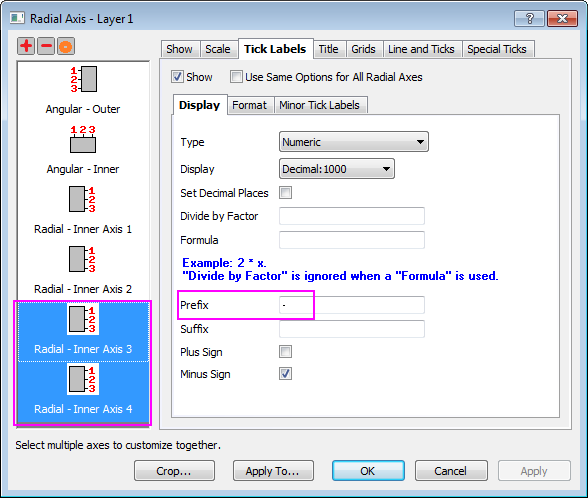
- Go to Tick labels tab, enter a minus sign(-) in the Prefix edit box under the Display subtab.
- Click OK button.
Further Customization
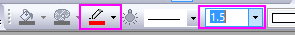
- To change the line plot color to red and a little thicker, select the line plot and on Style toolbar, set Line/Boder Color as red, and set Line/Border Width to 1.5.
- To add an equation to this graph as graph title, right-click on the graph and select Add/Modify Layer Title, then enter r=exp(q*cot(79.5p/180)) into the edit box.
- Origin supports rich text. So highlight q in the text and click
 button on Style toolbar to turn it into button on Style toolbar to turn it into  . Also turn p into . Also turn p into  . The text will look as below. . The text will look as below.
- To add shadow to the text and make the font bigger, right-click on the title and click Properties... to open the Object Properties dialog. In the Text tab, set font size to 26, and go to Frame tab to change Frame to Shadow. Click OK to save the setting.
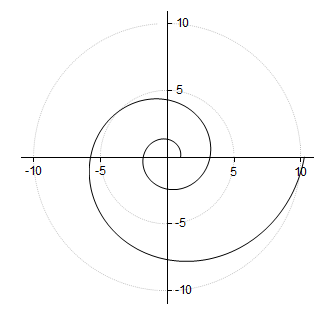
- Drag the equation to the desired position. The graph should look like the one in Summary.
|