6.11.3 Cropped Polar Plot with Custom OrientationPolar-Crop
Summary
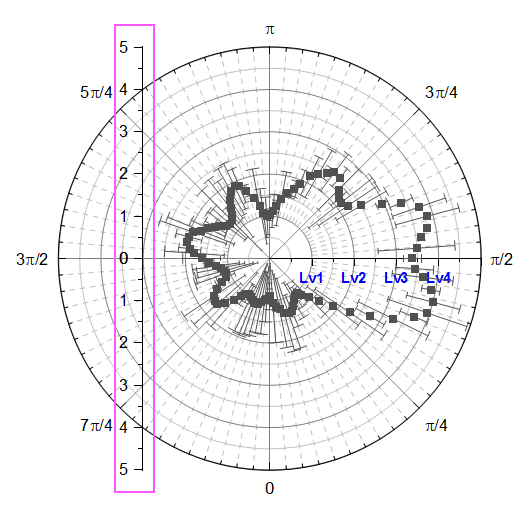
This tutorial will demonstrate how to create a cropped polar graph:
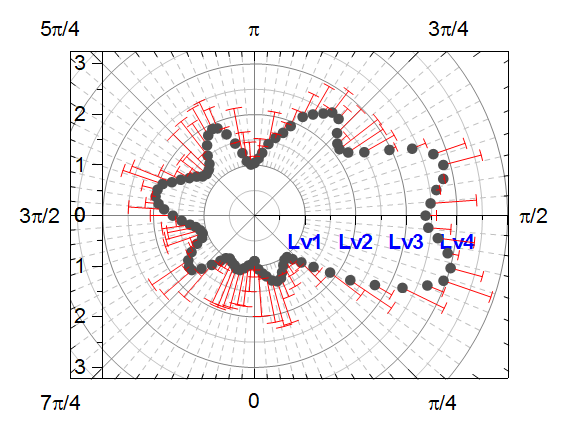
This graph shows a polar scatter plot with a radian scale. The graph axes orientation is customized and the graph is also cropped to show a specific portion of it.
Minimum Origin Version Required: 2015 SR0
What You Will Learn
This tutorial will show you how to:
- How to create a polar graph with radial axes
- How to customize the polar graph, such rotate a polar graph and display tick labels as quarters
- How to crop a polar graph
Steps
This tutorial is associated with the sample graph project "Cropped Polar Plot with Custom Orientation". You can open this project in Learning Center:
- Select Help: Learning Center menu or press F11 key to open Learning Center.
- Search and open the sample Polar Charts - Cropped Polar Plot with Custom Orientation under Graph Samples panel.
Create a Polar Graph and Customize the Axes
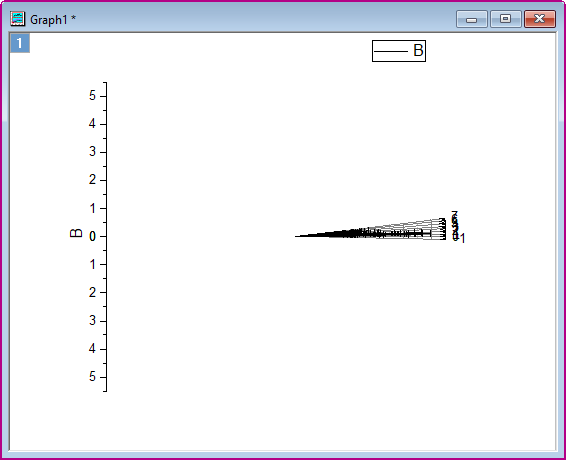
Activate the workbook Cropped Polar Plot with Custom Orientation. Highlight all the columns in Sheet 1 and choose Plot > Specialized: Symbol Θ r from the main menu to create a polar graph:
Customize Axes in Axis Dialog
- As the anglar axes uses Degrees as Unit by default. We have to customize Angular Axes:
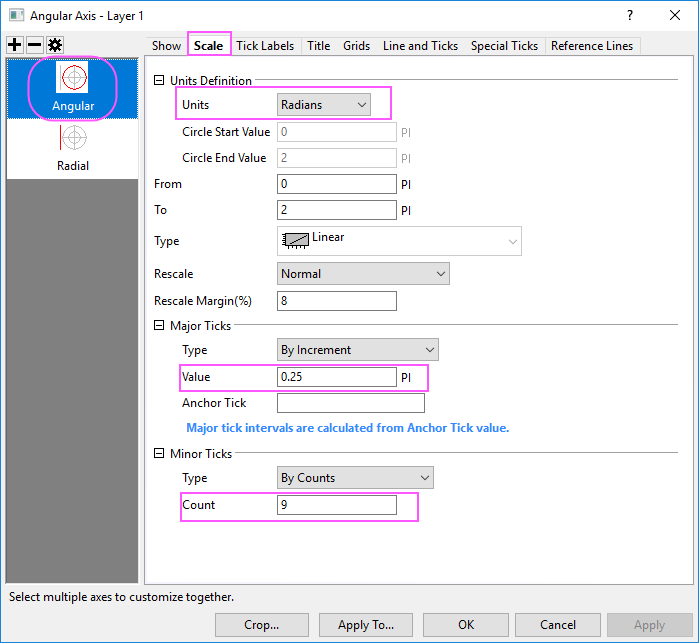
- Double-click on the axis to open the Axis Dialog. Go to Scale tab and choose Angular in the left panel. Expand Units Definition node and set Units to Radians from the drop-down list. Change the Value option under Major Ticks to 0.25, Count under Minor Ticks to be 9.
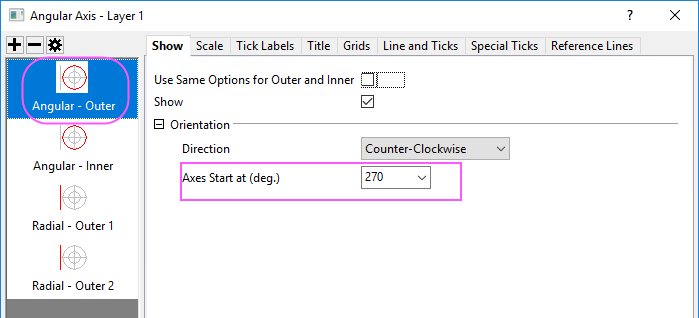
- To change the orientation of the plot, go to Show tab and make sure the Angular - Outer is selected in the left panel. Set Direction to Counter Clock-Wise and the Axis Start at(deg) to 270 as shown below:
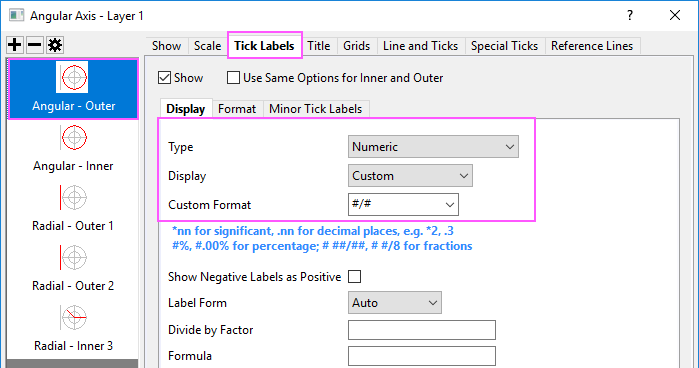
- Go to Tick Labels tab, set Display to Custom, Custom Format to #/#.
- Click Apply button to apply these settings.
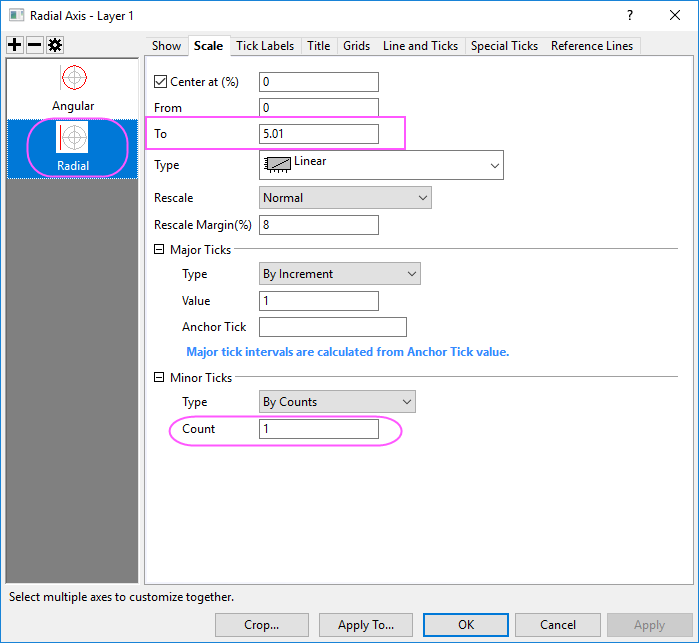
- Let's customize the Radial Axes scale. Go to the Scale node and choose the Radial in the left panel. Change the To value to 5.01 (the 0.01 will show the last tick), Count option under Minor Ticks to 0.
- Then, we are going to add a Inner Radial Axis
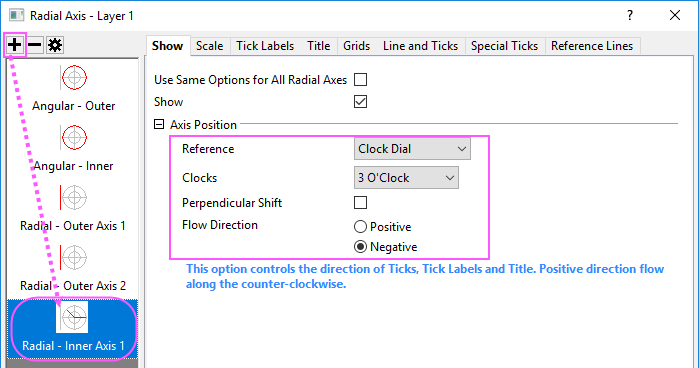
- In the Show tab, click on the Add a radial axis button on the top of the left panel. Then the Radial - Inner Axis 1 is added in the left panel.
- To change the orientation of the new inner axis from vertical to horizontal, under Axis Position section, set the Reference as Clock Dial and the Clocks option as 3 O'Clock. Select the Negative radio button to shift the tick labels to the opposite side of the axis:
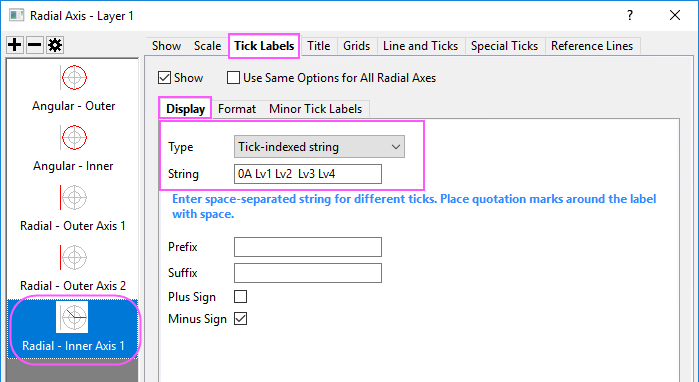
- To add tick labels on Inner Axis 1, go to Tick Label tab, under Display subtab and select Tick-indexed string from the Type drop-down. Type 0A Lv1 Lv2 Lv3 Lv4 in the Display edit box.
- Go to the Format subtab and change the tick label format as below:
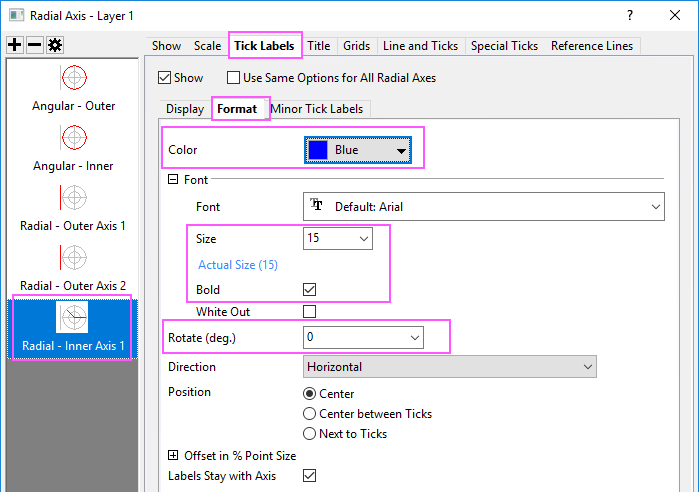
- Go to Special Ticks,set Axis Begin and Axis End to Hide.
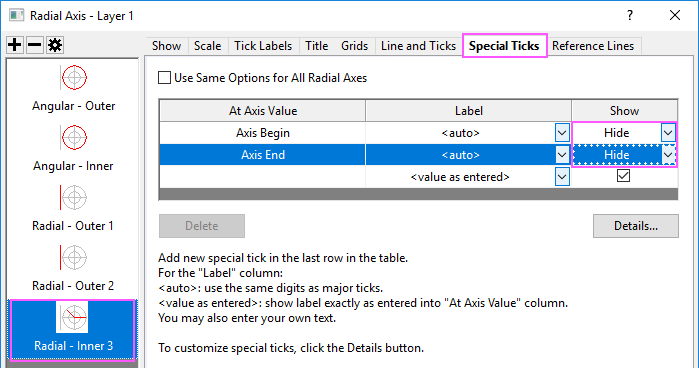
- Click Apply to apply these settings.
- Go to Grids tab, set grid lines of Radial and Angular axis as below:
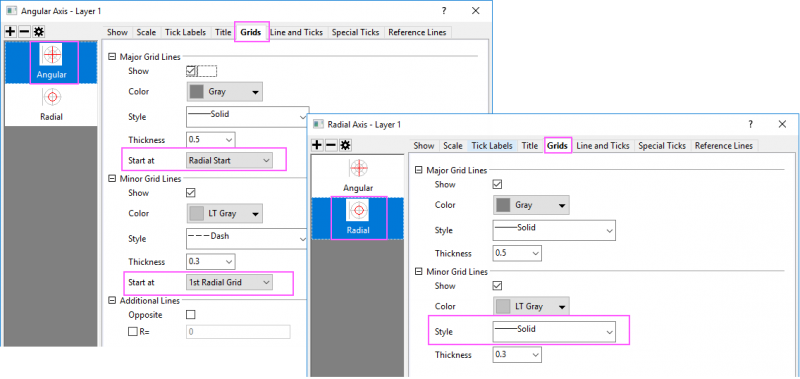 - Click OK button to apply these settings.
- Drag-and-drop two outer radial axes to the postion of % of Radius = -40.
Customize Scatter Plot with Mini Toolbar
We are going to customize the scatter plot with mini toolbar.
- Click on one data point, in the popup mini toolbar, set the symbol shape.

- Click on the error bar, in the popup mini toolbar, only show the plus Y error bars and set its color.
Crop the Polar Graph
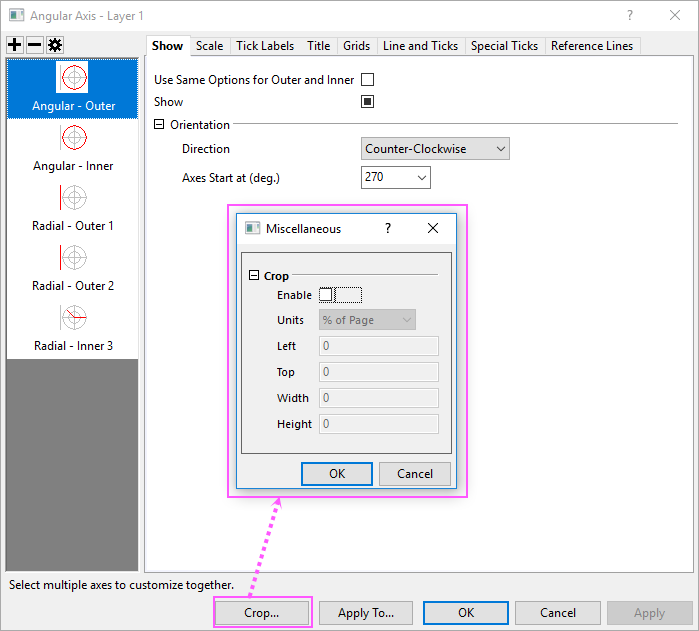
In Axis dialog, there is a button Crop... at the bottom. Clicking it will open a dailog which allows you to magnify and emphasize any particular section of the polar plot.
Select the Region You Want to Crop
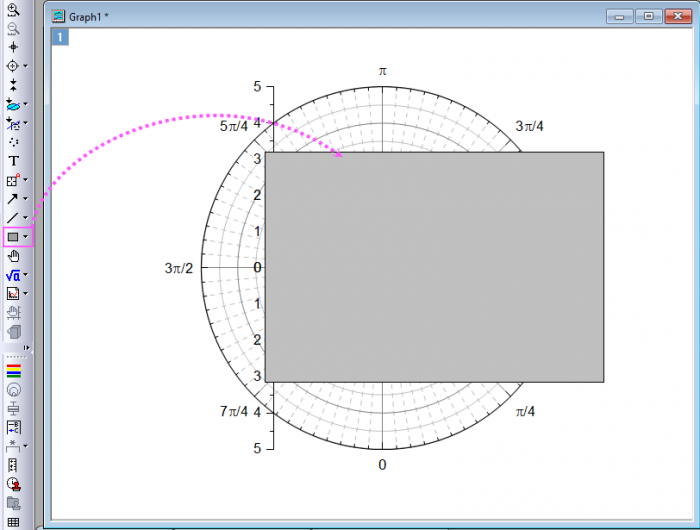
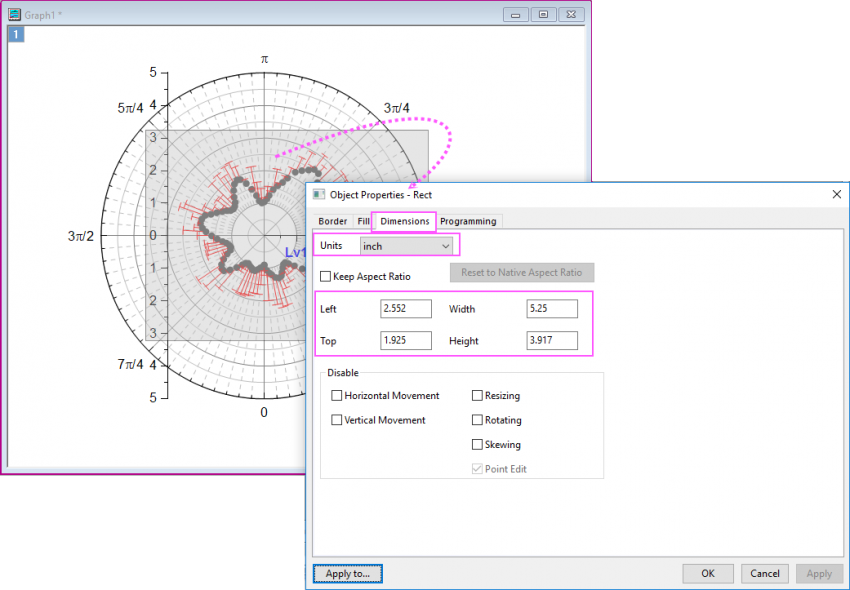
Before cropping the polar graph, you can use the Rectangle tool  to obtain the size and location data of the area of interest. to obtain the size and location data of the area of interest.
- Click the toolbar button Rectangle Tool and then draw a rectangle on the graph.
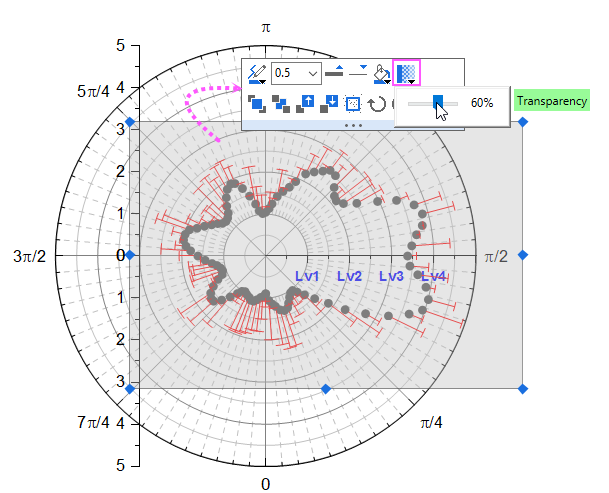
- In order to see the graph clearly when adjusting the size of the rectangle, click on the rectangle, in the popup mini toolbar, click Transparency button to set Transparency to 60%.
- Adjust the size and position of the rectangle. Once the rectangular area is ready, double-click it to open the Object Properties dialog box to get size and position data for the portion beneath the rectangle.
Crop the Graph
- Double-click on any axis to open the Axis Dialog again. Click on the Crop... button to open the Miscellaneous dialog. Check the Enable box and enter the size and position values you gotten from the rectangle object.
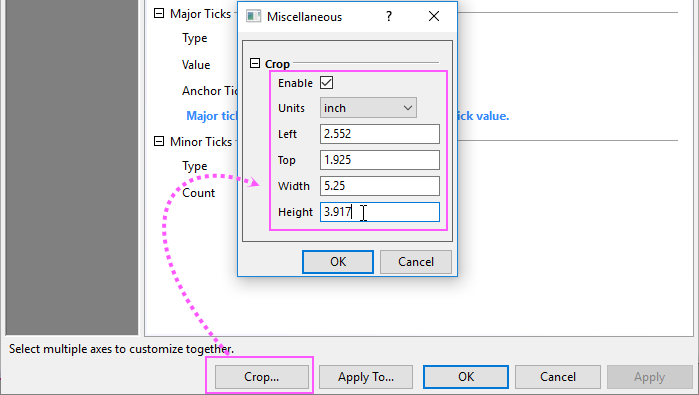
- Click OK to exit this mini dialog. And click OK button to close the Axis dialog. The graph will now appear as shown below:
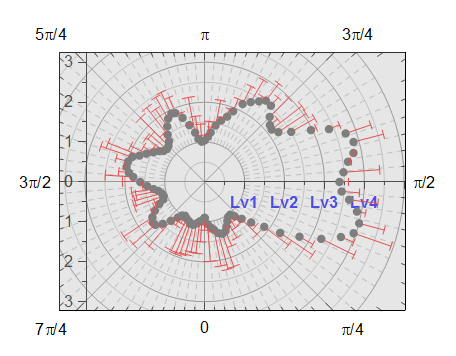
- As you can see, the area beneath the rectangle has been cropped out. Click on the rectangle object and delete it. Finally, you will get the graph below:
|