4.4.9.1 Stacking Worksheet ColumnsWks-Stacking-Cols
Stacking Columns by Column Label
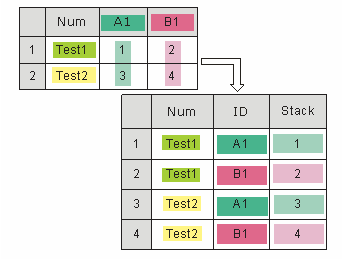
The Stacking Worksheet Columns tool is for converting data from the raw mode into index mode. In the original dataset, samples belong to different groups is stored in different columns. After stacking, they will be in different rows in the same column, with an additional column in the worksheet providing the group information (the group from which the original sample is from).
To use this function:
- Create a new worksheet with input data.
- Highlight the selected data.
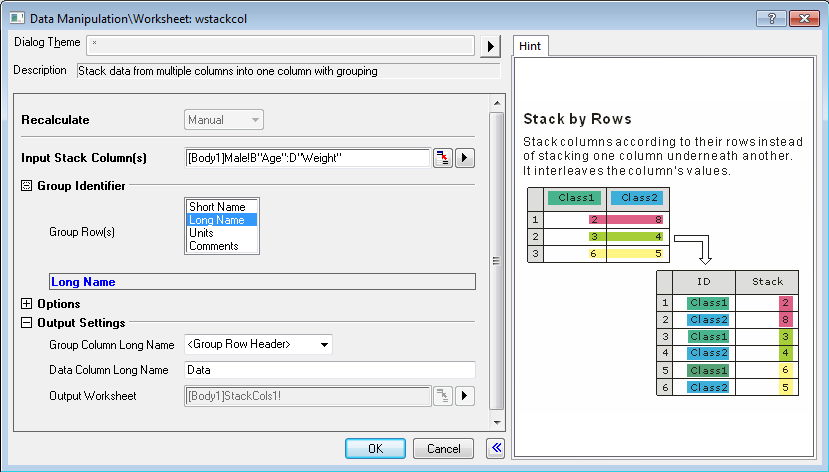
- Select Restructure: Stack Columns from the Origin menu to open the wstackcol dialog box.
In fact, the wstackcol X-Function is called to start this function.
Dialog Controls
| Recalculate
|
Specify how to recalculate the results. See details in Recalculating Analysis Results.
|
| Input Stack Column(s)
|
Specify the columns, from which the source data is. There should be at least two columns.
|
| Group Identifier
|
- Group Row(s)
- Select the column label rows which contain the group information. With this information, the tool identifies the group to which the samples belong. If there are multiple rows selected, the selected order of the groups will show in the lower text box.
|
| Options
|
The stacking options.
- Include Other Column(s)
- Specify whether to Include Other Column(s) in the output. If this check box is selected, you are allowed to pick the columns to be included.
- Stack into Subgroups
- Specify whether to stack the original samples into several subgroups. If this is not selected, all of the input samples will be stored in one column only. If this check box is selected, you are allowed to specify the number the subgroups, or the number of columns into which the samples are stacked.
- Suppose there are 6 groups in the original data and you choose to stack them into two subgroups, the first, third, and fifth groups will be in the first subgroup while the rest will be in the second subgroup.
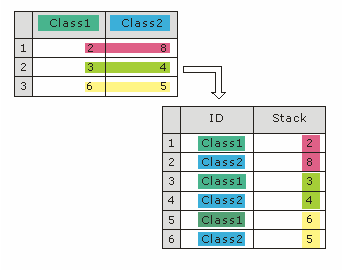
- Stack by Rows
- Specify whether to interlace samples from different groups.
- Suppose there are two groups in the original dataset and this option is selected, the even rows in the output column will be samples that belong to the first group, while the odd rows will be samples from the second group. If this check box is not selected, the first n rows in the output column (n is the number of samples in the first group) will contain the samples from the first group while the rest rows will contain the samples from the second group.
- Exclude Missing Rows
- Specify whether to ignore rows that contain missing values in the source columns.
|
| Output Settings
|
- Group Column Long Name
- Specify the long name for the group column. Options include:
- <Group Row Header>
- The row header from which the group information is from, in other words, the selection of Group Row(s) (see above).
- Group
- Groupn.
- Class
- Classn.
- Data Column Long Name
- Enter the long name for the output data column. The long name will be enumerated.
- Output Worksheet
- Specify the worksheet for outputting the results.
|
How to Stack Columns
This function can stack columns, stack columns by row. It also allow including other columns and specifying the number of subgroups. So, combined with each other, there are several ways of stacking columns as following.
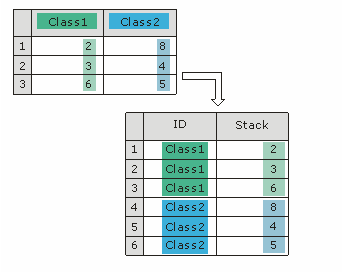
- Stack values from several columns into several rows in a group.
- Stack columns according to their rows instead of stacking one column underneath another. It interleaves the column's values.
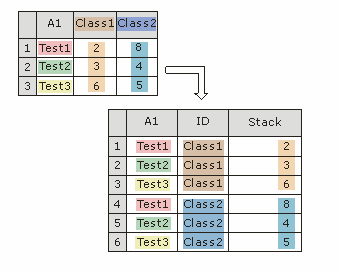
- Stack and Include Other Column(s)
- This kind of stacking will Include Other Column(s) from the original worksheet plus the newly stacked columns in new worksheet.
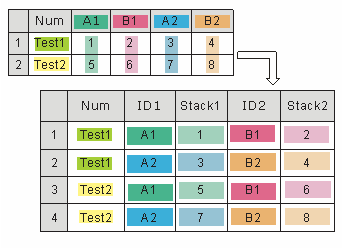
- Stack by Row and Include Other Column(s)
- Stack columns according to the rows and include non-stack columns from the original worksheet.
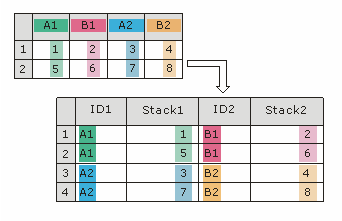
- Stack multiple columns into two or more groups.
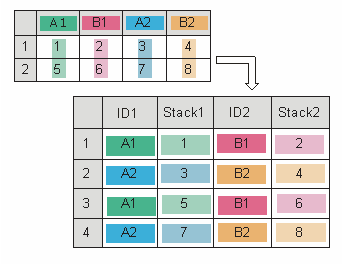
- Stack by Rows and Stack into Subgroups
- Stack multiple columns into two or more groups according to their rows.
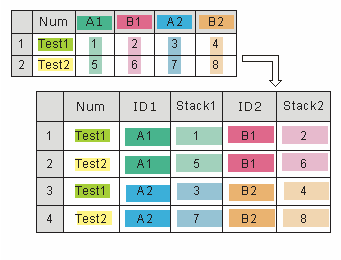
- Stack into Subgroups and Include Other Column(s)
- Stack multiple columns into two or more groups and include non-stack columns from the original worksheet.
- Stack by Rows, Stack into Subgroups and Include Other Column(s)
- Stack multiple columns into two or more groups according to their rows and include non-stack columns from the original worksheet.
Example
The following example will stack columns in a sample data file so that it is displayed in another form.
- Open the file \Samples\Statistics\Body.ogw.
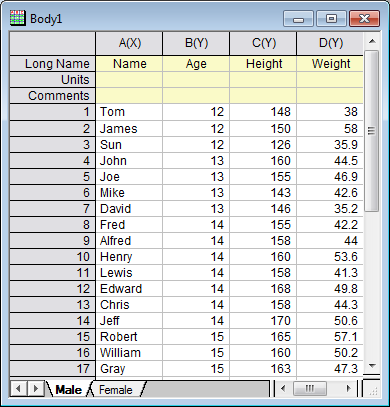
- Highlight column B, C and D in the Male worksheet and then select Worksheet: Stack Columns from the Origin menu to bring up the wstackcol dialog.
- Select Include Other Column(s) check-box and Stack by Rows check-box, other settings keep the default values.
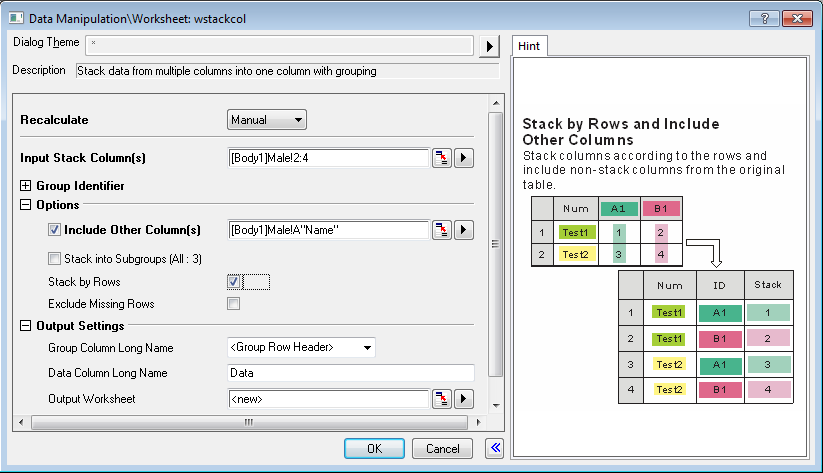
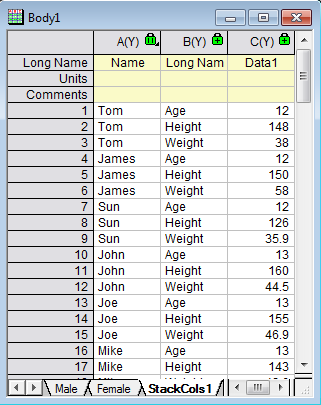
- Click OK to execute. You will get the following result:
Stacking Columns by Column Designation
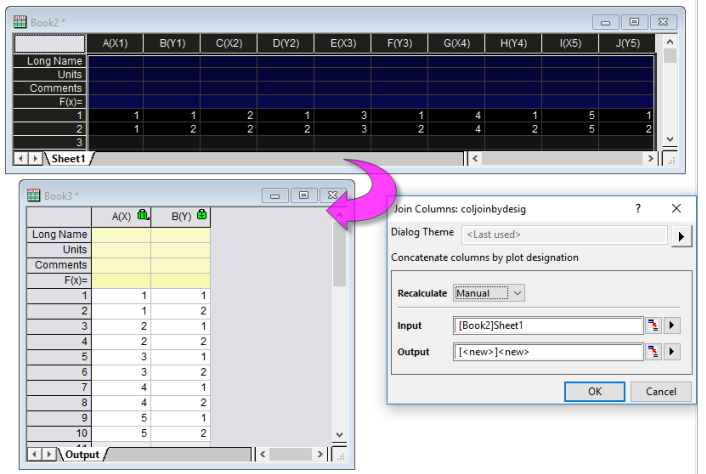
We can also stack worksheet columns by Column (Plot) Designation. The coljoinbydesig X-Function dialog is not available from the menu but it it can be opened in the user-interface:
- Click on the Window menu and open the Script Window or Command Window.
- At the prompt, copy and paste (or type) the following and press Enter:
coljoinbydesig -d
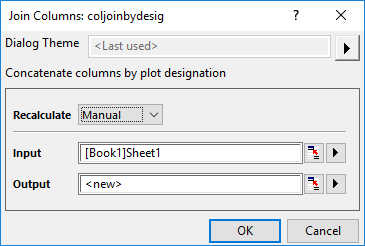
Use of the dialog controls is straightforward:
- Input is the worksheet data that you wish to stack by column designation.
- Output is where you wish to output the stacked data (new sheet, new book, etc.).
|