15.3.8.3 Comparing Datasets (OriginPro Only)PostFit-CompareDataset-Dialog
This tool is used to compare two fitting results from the same fitting function for two different fitting datasets. F-test is used to determine whether the two datasets are significantly different from each other.
To use this tool,
- Perform fitting on two different datasets, using the same fitting function, and create two fitting reports.
- Select Analysis: Fitting: Compare Datasets from Origin menu.
Dialog settings are listed in the following sections.
| Note: When perform the fitting on multiple datasets simultaneously, please make sure the fitting results reports of each dataset are output to different worksheets, or Origin can not recognize the fitting results.
To ensure that, while you perform the fitting, set Multi-Data Fit Mode as Independent Fit - Separate Reports. For nonlinear curve fitting, go to the Settings tab of the NLFit dialog, select Data Selection on the left panel, you can find this setting on the right panel.
|

|
Example
Suppose we have 2 datasets and would like to see whether they are different for same model,

Operation
- Import Exponential Decay.dat on \Samples\Curve Fitting folder.
- Highlight Col(B), select Analysis: Fitting: Nonlinear Curve Fit to open dialog. Set Function as ExpDec1. Click OK to get result sheet.
- Highlight Col(C) and select Analysis: Fitting: Nonlinear Curve fit: 1<last used> to quick fit Col(C) with same model.
- Select Analysis: Fitting: Compare Datasets to open dialog.
- Click browse button to open Report Tree Browser and select 1 item for Fit Result1.
- Repeat same operation to select another item for Fit Result2.
- Select Fit Parameters and Fit Statistics and click OK.
- From F-test table, we can roughly draw conclusion that Col(B) and Col(C) are different when fit with expDec1 model.
|
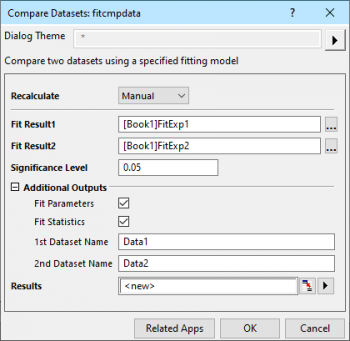
Dialog Controls
Recalculate
Specify the way to recalculate and update the result if there is any change in the input data.
See:
- Recalculating Analysis Results
Fit Result1
Specify the first fitting result. Click Report Tree Browser button  on the right of Fit Result1 box, all fitting reports are shown in the Report Tree Browser dialog. You can choose a fitting report as Fit Result1 in the Report Tree Browser dialog. on the right of Fit Result1 box, all fitting reports are shown in the Report Tree Browser dialog. You can choose a fitting report as Fit Result1 in the Report Tree Browser dialog.
Note that Origin doesn't support to compare fitting datasets for fitting results using an ODR algorithm. For example, fitting results using the same implicit function will not be shown in Fit Result1's Report Tree Browser dialog.
Fit Result2
Specify the second fitting result. Click Report Tree Browser button on the right of Fit Result2 box, only fitting reports whose fitting function is the same as Fit Result1's are shown in the Report Tree Browser dialog. You can choose a fitting report as Fit Result2 in the Report Tree Browser dialog.
Significance Level
Default is 0.05. Values between 0 and 1 are supported.
Additional Outputs
Specify whether to output fitting tables.
| Fit Parameters
|
Specify whether to output Fit Parameters table for each fitting dataset.
|
| Fit Statistics
|
Specify whether to output Fit Statistics table for each fitting dataset.
|
| 1st Dataset Name
|
Specify a name displayed in the result sheet table for the first dataset relative to the Fit Result1. The default name is Data 1.
|
| 2nd Dataset Name
|
Specify a name displayed in the result sheet table for the second dataset relative to the Fit Result2. The default name is Data 2.
|
Results
Specify the output report worksheet for the comparison result.
See: Output Results
|