28.1.15 The Style ToolbarStyle-Toolbar

The Style toolbar is useful for formatting text labels and other annotations including table objects as well as data plot attributes (line style, line color, symbol color, fill pattern, etc.).

|
Sets the fill color of the selected object
|

|
Sets the line/border color of the selected object
|

|
Open 3D lighting control dialog
|

|
Apply the pattern to the selected plot.
|

|
Sets the line/border color of the selected object
|

|
Sets the line/border width (pt. size) of the selected object
|

|
Sets the fill pattern of the selected object
|
|
|
Sets the fill pattern width of the selected object
|

|
Sets the fill pattern color of the selected object
|

|
Clear borders from selected worksheet cell range
|

|
Add a left border to the selected worksheet cell range
|

|
Add a top border to the selected worksheet cell range
|

|
Add a right border to the selected worksheet cell range
|

|
Add a bottom border to the selected worksheet cell range
|

|
Add a frame border to the selected worksheet cell range
|

|
Add inside horizontal borders to the selected worksheet cell range
|

|
Add inside vertical borders to the selected worksheet cell range
|

|
Add inside horizontal and vertical borders to the selected worksheet cell range
|

|
Add all horizontal borders to the selected worksheet cell range
|

|
Add all vertical borders to the selected worksheet cell range
|

|
Add inside and outside borders to the selected worksheet cell range
|

|
Merge cells.
|
Using the Style Toolbar to edit plot attributes
To use the Style toolbar for editing plot attributes, you must first click on the data plot and select it. Note the "handles" on the selected data plot.
- For ungrouped data plots, clicking on a single data plot selects just that data plot.
- To select multiple ungrouped data plots, hold down the SHIFT key while selecting plots to edit.
- For grouped data plots, clicking on any data plot in the group selects the entire group.
Once a data plot or a plot group has been selected, you can edit various attributes of the plot -- symbol color, line style and width, fill patterns, incremental color lists for grouped data plots -- using the Style toolbar. This is faster as it avoids your having to open the Plot Details dialog box.
Note that not all plot attributes can be edited with the Style toolbar (for example, to change plot symbol type, you need to open the Plot Details dialog box).
To apply an incremental color scheme to a plot group:
- Click to select the entire plot group.
- Open the Color drop-down list and choose an incremental color scheme.
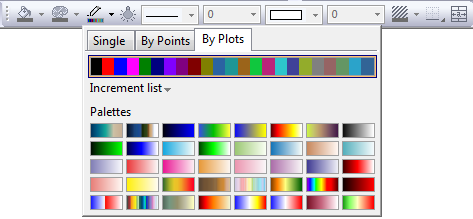
Origin ships with some ready-to-use incremental color schemes. These are actually a type of Theme (see, Creating Themes). To learn how to create a new incremental color list, see Group Incremental Color Lists.
Using the Style Toolbar to edit tables
To use the Style toolbar for editing tables, you must first select the table. A table can exist both on a graph as well as in a worksheet. After you perform an analysis such as linear fitting, result tables may be pasted to your graph as well as appear in the newly created Result sheet in the worksheet. Likewise, you can create your own table on the graph by right-clicking where you want the table to appear and selecting New Table from the context menu. You can create a table in a worksheet by selecting any worksheet cell range and then turning on borders for that selection.
|