27.3 Batch ProcessingBatch-Processing
The Batch Processing tool allows you to perform repeat analysis on multiple datasets using an existing Analysis Template and optionally output analyzed results to a Word Template for reporting. You can process multiple data files from disk, or loop over data already in your project.
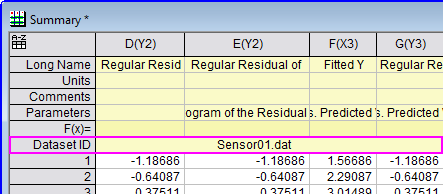
To create an Analysis Template, perform an operation (e.g., curve fitting) and set Recalculate to Auto or Manual. You can optionally add a Result Sheet, which contains paste-linked results (e.g., the file name, or a subset of values from the parameter table generated by a curve fitting) from the analysis operation. You can then use the Batch Processing tool to create a Summary Report compiling Result Sheet data from multiple files or datasets.
Optionally you can choose to output analyzed results directly into a Word/PDF file using bookmarks in a Word template. The bookmarks in a Word template can only be utilized when added to a specified analysis template using Add Word Bookmarks to Analysis Template dialog. An additional Bookmarks worksheet will be automatically generated to store the bookmarks, analysis results cell-linked from the analysis report and sizes of graphs to be exported.
When the tool is used to process multiple disk files, the import settings (e.g., custom ASCII settings, or filter settings from the Import Wizard) can be saved as part of the Analysis Template. Variables extracted while importing can be paste-linked into the Result Sheet, and this information will then appear in the Summary report create by the Batch Processing tool.
The Analysis Template can include:
- The Raw Data worksheet.
- The Analysis Report worksheet. These are report sheets generated by analysis procedures (e.g., nonlinear fitting).
- An optional Result Sheet containing analysis results cell-linked from the analysis report, and import variables, such as the file name or any parameters extracted from the file header.
- An optional Bookmarks worksheet automatically generated when adding bookmarks from a Word template to the analysis template. The Bookmarks worksheet contains a Bookmarks column to store bookmarks from the Word template, a Links column to store analysis results cell-linked from the analysis report and a GraphWidth column to adjust the size of graphs to be exported to word/pdf files.
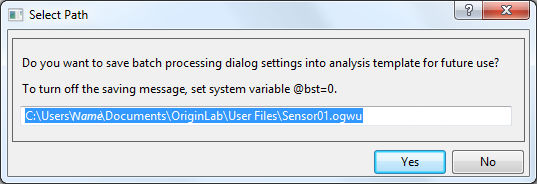
After completing all desired settings in the Batch Processing dialog and click OK, every setting except Batch Processing Mode and contents in File list will be saved into the analysis template for future use. For Batch Processing Mode set to Repeatedly Import into Active Window, the analysis template will be saved to UFF by default. For Batch Processing Mode set to Load Analysis Template, it will update the original template (in this case the analysis template should not be in Origin installation folder or subfolder, otherwise it will be saved to UFF).
Note:
- The batch processing settings will be saved only when open the Batch Processing dialog. If running batchprocessing X-Function from scripts, the settings will not be saved.
- If you want to save the dialog settings to another path other than the default, you can set system variable @BST = -1 to open the save batch processing dialog settings into analysis template message box after clicking OK in the Batch Processing dialog, which allows you to choose whether to save the settings and where to save. You can set @BST by selecting Tools: System Variables .
|
 | While not as flexible or powerful as the Batch Processing, you can "clone" import and analysis operations in the active workbook, using the procedure outlined in this tutorial.
|
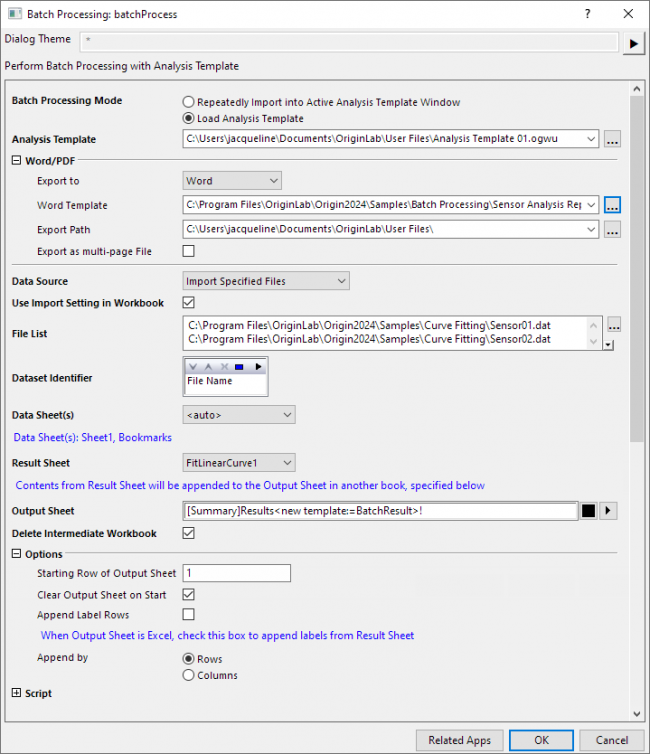
The Batch Processing Dialog Box
To open, click File, and then click Batch Processing.
| Batch Processing Mode
|
Specifies how to perform batch processing.
- Repeatedly Import into Active Window
- Repeatedly import data into the active workbook window, assuming the workbook has already been set up as an Analysis Template.
- Load Analysis Template
- Load a specific Analysis Template workbook (.OGW) from disk.
|
| Analysis Template
|
Available when Batch Processing Mode is set to Load Analysis Template. Use this to specify the analysis template for the batch processing.
|
| Export to
|
Only available when active/loaded analysis template contains a sheet named Bookmarks. Use this option to specify which file type the analysis report to be exported, options are:
- None
- Do not export files.
- Word
- Export to a Word file.
- PDF
- Export to a PDF file.
- Word&PDF
- Export to both a Word and a PDF file.
|
| Word Template
|
Only available when active/loaded analysis template contains a sheet named Bookmarks. Use this option to specify the Word template for reporting the batch analysis results.
|
| Export Path
|
Only available when active/loaded analysis template contains a sheet named Bookmarks. Use this option to specify where to export batch analyzed results using bookmarks in a Word template. Note the Word and PDF files will be exported to same location.
|
Export as
multi-page File
|
Check this box to combine all PDF or Word files into a single file.
|
| Data Source
|
Data source can be
- Import Specified Files
- Import data from specified files. If the analysis template includes Data Connector, Data Source must be Import Specified Files.
- Import All Files from Folder
- Import all files from specified folder.
- Use Existing XY Datasets
- Perform batch processing on XY Range Data in the current project.
- Use Existing XYZ Datasets
- Perform batch processing on XYZ Range Data in the current project.
- Use Existing Worksheets
- Perform batch processing on selected worksheets in the current project.
This option will be useful for statistics tools that don't look at data. If you have set the worksheets up with same structure, selecting this option will copy worksheet contents to the analysis template and take the process one by one.
- Use Existing Ranges
- Perform batch processing on selected ranges in the current project.
|
| Use Import Setting in Workbook
|
Only available when Data Source is Import Specified Files. Specify whether to use the last data import settings.
|
| File List
|
Available when Import Specified Files is used. Select data files for batch processing. *.dat, *.txt, *.csv, *.xls, *.xlsx, *.xlsm files are supported.
Beginning with Origin 2018b, you can embed matrices in workbooks, including Analysis Templates and these matrices can supply the source data that drive your batch analysis. Because matrices can store data or images, you can import data files (*.dat, *.txt, etc.) to a matrix that is set to display in data mode or image mode; or you can import image files (*.jpg, *.tif, etc.). You can import files into matrices in either Batch Processing Mode.
|
| Folder
|
Available when Data Source is Import All Files from Folder. Specify the folder for the imported files.
|
| File Extension
|
Available when Data Source is Import All Files from Folder. Specify the extension for the imported files. It supports multiple extensions separated by semicolon.
For example: *.dat*; *.csv*
|
| Input
|
Available when Data Source is set to Use Existing XY(Z) Datasets. Specify the XY(Z) Range for analysis from anywhere in the project, such as the current sheet, current book, or any selection performed with the Dataset Browser tool. (To access the Dataset Browser tool, click the arrow to the right of Input , and then click Select Columns... )
|
| Worksheets
|
Available when Data Source is set to Use Existing Worksheets. Click the rightward-pointing arrow to filter by Sheets in Book, Sheets in Folder, Sheets in Folder(Recursive) or Sheets in Project. Alternately, you can choose Select Worksheets to open the Sheet Browser. Reset will clear the selection window.
|
| Fixed Range
|
Available when Data Source is set to Use Existing Ranges. Specify the fixed ranges which will just be copied to the corresponding columns in the data sheet of template but do not take part in calculation during each processing loop.
|
| Batch Range
|
Available when Data Source is set to Use Existing Ranges. Specify the batch ranges which are used as input for the calculation during batch processing.
|
| Dataset Identifier
|
Specify whether to add a column with the Long Name "Dataset" to the Result Worksheet for identifying each analysis dataset.
- If None, this column will not be added.
- When Data Source is Import Specified Files, options are File Name plus the designated data sheet's displayed Column Label Rows.
- When Data Source is Import All Files from Folder, options are File Name plus the designated data sheet's displayed Column Label Rows.
- When Data Source is Use Existing XY(Z) Datasets, options are File Name plus the designated data sheet's displayed Column Label Rows.
- When Data Source is Use Existing Worksheets, options are Range, Book Name and Sheet Name.
- When Data Source is Use Existing Ranges, options are Range, Book Name and Sheet Name.
|
| Designation
|
This control is added when you set Dataset Identifier to a displayed Column Label Row in the Analysis Template (not available when Mode = Repeatedly Import... and Source = Import Specified Files or Import All Files from Folder).
Use to specify which column supplies the dataset identifier. Default <auto> uses the current setting.
|
| Data Sheet(s)
|
Specify the name of the sheet in the Analysis Template into which the raw data should be imported. If there are multiple data sheets in the Template, option <auto> should be selected so that grouped files can be imported sequentially into corresponding data sheets. Furthermore, there is another option <custom> which can be used to add and remove the data sheets found by the default option <Auto>.
Files can be sorted by Name, Size or Date by clicking column headings in the lower panel of the Open dialog, when selecting files to import (under Data Source).
Note that you can save import settings, such as custom ASCII import settings or Import Wizard filters, to the data sheet in your Analysis Template. See saving ASCII settings and Save Filters page for more details.
|
| Result Sheet
|
Specify a Result Sheet (optional) in the Analysis Template, to contain the information you want to summarize for each dataset or file processed by the Batch Processing tool. When Result Sheet is <none>, Data Identifier is disabled.
|
| Output Sheet
|
Content from the Result Sheet will be appended to the Output Sheet specified in this field:
- The default -- [Summary]Results<new template:=BatchResult>! -- writes output to sheet named Results in a book created from the BatchResult template that resides in the Origin program folder.
- Choosing <new> from the flyout menu writes output to an Output Sheet in the active workbook or if no workbook exists, to a new workbook.
- Choosing [<new>]<new> from the flyout menu writes output to an Output Sheet in a new workbook.
- Choosing an existing sheet writes output to that sheet.
When Result Sheet is <none>, Output Sheet is unavailable.
Note: When (1) Batch Processing Mode = Load Analysis Template, (2) Data Source = Import Specified Files and (3) Output Sheet = [Summary]Results<new template:=BatchResult>!, the BatchResult template will show three buttons in the spacer at the top of the window:
- Open Book(s): If you enable Delete Intermediate Workbook (see next), then later decide you need that data, you can highlight corresponding rows in the Results sheet and click this button to regenerate deleted books.
- Reprocess: Click this button to re-run import of selected files and update results when there have been changes to external data files.
- Update: Click this button to update results for selected files when something is changed on the input side of your analysis (e.g. masking of data in your data sheets).
|
|
| Delete Intermediate Workbook
|
Specify whether to delete the intermediate analysis outputs after the process.
See the "Note" under Output Sheet, above.
|
| Options
|
Including:
- Starting Row of Output Sheet
- Specify the beginning row in the Output sheet to append results.
- Clear Output Sheet on Start
- Clear the output sheet when starting batch processing. Clear this check box if you are repeating the analysis on a new set of files or datasets and you want the summary information appended to existing summary information from previous batch analysis.
- Append Label Rows
- This check box is unselected by default. It is used to specify whether append the label rows to the column cells below the column label rows.
- When output sheet is Excel sheet, as there is no column label row at the beginning of sheet, you can use this option to append the labels to the column cells.
- Append by
- Specify how to append the analysis results, by Rows or by Columns For Rows option, see Output Sheet setting, above. When you choose the Columns option, a user-defined parameter row labeled Dataset ID, will be added to identify the data source.
|
| Script
|
Including:
- Script Before Each Process
- LabTalk script to run before each file or dataset has been processed. Note that:
- fname$ refers to the i-th file
- _rx refers to the range of i-th x dataset
- _ry refers to the range of i-th y dataset
- _skip determines if i-th file/dataset will be skipped
- _i1 refers to the starting row index of the i-th dataset
- _i2 refers to the ending row index of the i-th dataset
- Script after Each Process
- LabTalk script to run after each file or dataset has been processed. Note that:
- _i refers to the index of i-th file/dataset
- _book$ refers to the i-th book name
- Variable i and __BATCHBOOK$ defined in earlier version are replaced by _i and _book$, respectively.
- Script at the End
- LabTalk script to run at the end of the process.
|
Examples
Example 1: Import .DAT files and perform nonlinear curve fitting
In this example, we will import three .dat files and perform a nonlinear curve fitting.
- On the main menu, click File, and then click Batch Processing... to open the Batch Processing dialog.
- Make sure Load Analysis Template is selected. Click the
 button to the right of Analysis Template. Navigate to the Origin installation folder, and then \ Samples\ Curve Fitting to select Linear Regression.ogw. button to the right of Analysis Template. Navigate to the Origin installation folder, and then \ Samples\ Curve Fitting to select Linear Regression.ogw.
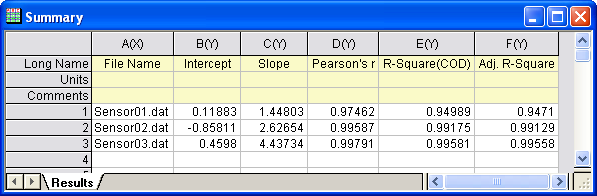
- Make sure Data Source is set to Import From Files. Click the button to the right of File List, and then navigate to \ Samples\ Curve Fitting to add Sensor01.dat, Sensor02.dat, and Sensor03.dat. Set the remaining dialog values as in the image below:
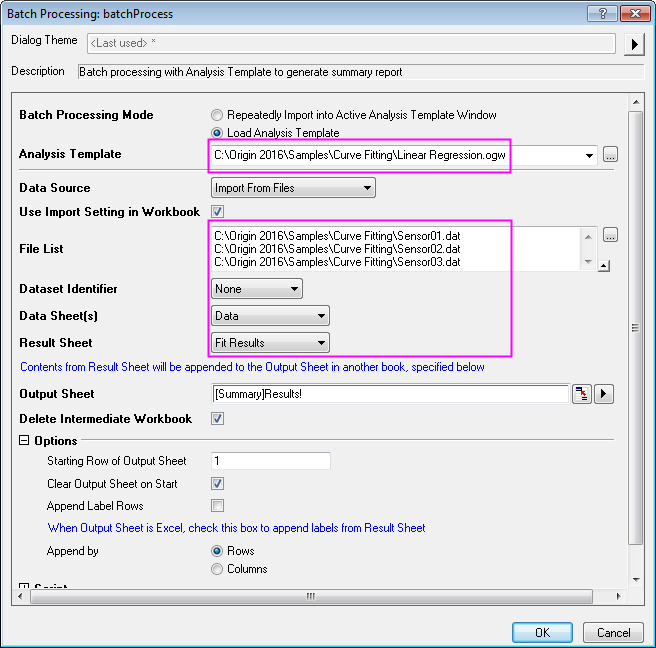
- Click OK to process the three .dat files and output statistics to a Result Sheet.
Example 2: Perform batch analysis on groups of CSV files
This Tutorial illustrates how to perform batch analysis on grouped datasets using an analysis template with multiple data sheets.
Example 3: Perform batch analysis and create reports using a custom MS Word template
This tutorial illustrates how to perform batch analysis with Word template for reporting.
Example 4: Perform batch processing on worksheets in your project file
If you have already imported source data into multiple worksheets in the project, or you want to perform batch processing on multiple worksheets which are the intermediate results of pre-processing, Data Source = Use Existing Worksheets is used. The following example shows you how to perform batch processing on mulitple worksheets.
We use Excel file HouseholdCareSamples.xls under folder <Origin installation folder>\Origin2018\Samples\Statistics\ in this example. The Excel file contains multiple worksheets, each has the cleaning product stocks of a super market. We are going to calculate stocks of different kinds of every market and summarize them in a result sheet.
We need to prepare the analysis template first
- Select Data: Import from File: Excel(XLS, XLSX, XLSM)... from the main menu. Specify as follow and click OK
- Browse and select <Origin installation folder>\Origin2018\Samples\Statistics\HouseholdCareSamples.xls for File Name.
- Expand File Info: File Sheet(s) and select only HQ Family Mart to import the first sheet of the file.
- Expand Header Lines branch. Set Number of Subheader Lindes to 1 and Long Names to 1 to set the first line as Long Name,
- With the imported HQ Family Mart worksheet active, highlight col("Number") and select Statistics: Descriptive Statistics: Statistics on Columns. In the dialog that opens, specify as follow and click OK.
- On the Input tab, select column E(Y): Category for Group,
- On the Quantities tab, make sure N total, Sum, Minimum, Median and Maximum are checked and uncheck Mean and Standard Deviation.
- The DescStatsQuantities worksheet is the result sheet we want. Rename it to StatsResult'. And rename HQ Family Mart worksheet to Data. Right click on the title bar of the workbook window and select Sav as Analysis Template to save it to MyDesStats.ogwu.
We can then import the whole Excel file and perform batch processing.
- Select Data: Import from File: Excel(XLS, XLSX, XLSM)... from the main menu to import file <Origin installation folder>\Origin2018\Samples\Statistics\HouseholdCareSamples.xls. Specify as follow and click OK.
- Set Multi-File (except 1st) Import Mode to Start New Sheets, *Expand Header Lines branch. Set Number of Subheader Lindes to 1 and Long Names to 1,
- check Apply Header to All Sheets.
- With the imported workbook active, select File: Batch Processing... from the main menu to open the Batch Processing dialog.
- Make sure Load Analysis Template is selected. Click button to the right of Analysis Template, and then select the analysis template we saved in the previous steps.
- Change Data Source to Use Existing Worksheets. Click the triangle button of Worksheet and select Sheets in Book from the fly-out menu to add all sheets.
- Set Dataset Identifier to Sheet Name, Data Sheet(s) to Data and Result Sheet to StatsResult. Click OK to process the 9 sheets and output statistics to a Result Sheet.
Example 5: Perform batch processing on datasets grouped by worksheet column
Select Help:Origin Central - Analysis Samples tab, set Samples in to Batch Processing, and then click Batch Processing Grouping Columns to see an example of how to use multiple ranges with grouping info as input to perform batch statistics.
|