1.4 Merge and Arrange GraphsGSB-Merge-Arrange-graphs
In this lesson we will create some graphs, merge them, and then arrange layers in the merged graph. We will also save the graph as a cloneable template to quickly re-create the graph from similar data.
Import data and create graphs
- Open the project file we saved in lesson three:Data Selection. In Project Explorer, create a new folder under the root folder and rename it as Merging Graphs. Click on the empty folder to open it.
- Click the New Workbook
 button on the Standard toolbar to new a workbook. Select Help: Open Folder: Sample Folder... to open the "Samples" folder. In this folder, open the Statistics subfolder and find the file automobile.dat. Drag-and-drop this file into the empty worksheet to import it. button on the Standard toolbar to new a workbook. Select Help: Open Folder: Sample Folder... to open the "Samples" folder. In this folder, open the Statistics subfolder and find the file automobile.dat. Drag-and-drop this file into the empty worksheet to import it.
- Click on the header of column C to select the entire column. Click the Scatter button
 on the 2D Graphs toolbar to create a scatter graph. on the 2D Graphs toolbar to create a scatter graph.
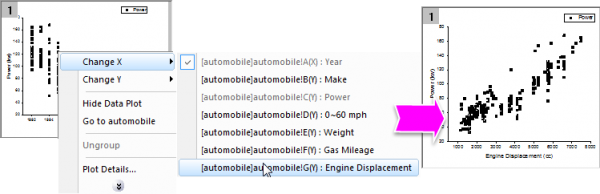
- Click on the scatter plot to select it, then right-click on the plot and select Change X: [automobile]automobile!G(Y):EnginDisplacement from the context menu to change the X data. A reminder message pops up asking if you would like to rescale the graph. Select Yes and press OK.
 | Reminder messages have multiple options. If you select Yes, and do the same in the future, no need to ask again, the dialog will not show again. You can reactivate all reminder messages from the menu Help: Reactivate Reminder Messages.
|
- Select the legend and press the Delete key to delete it.
- We will now make copies of this graph and change the data in the copies. First go back to the worksheet, and press the X button on the top right of the title bar, and in the dialog that pops up, select Hide. This simply hides the window from the interface.
| Hidden windows are displayed with a dimmed icon in the lower panel of Project Explorer. You can double-click on the entry to re-open the window.
|
- Right-click on the graph window title bar and select Duplicate to create a copy. Do this two more times, so you end up with four graph windows.
- Select the menu Window: Tile Vertically to arrange the 4 graphs without overlap.
- Use the Change X/Change Y menu described before, to change X/Y designations for the copy graphs as below, and rescale when promoted:
- Copy 1: Change Y to [automobile]automobile!D(Y):0^60 mph
- Copy 2: Change X to [automobile]automobile!E(Y):Weight
- Copy 3: Change X to [automobile]automobile!F(Y):Gas Mileage
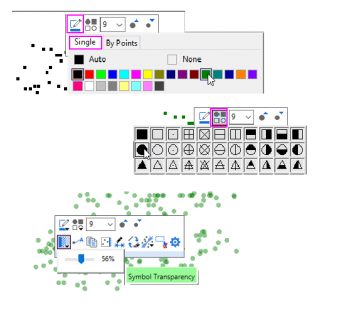
- Activate the graph of "Power" vs. "Weight". Let's do some customization. Click on the data plot, in the pop-up mini toolbar, change the plot properties as follows:
- Change Symbol Color to Olive.
- Change Plot Symbol to Circle.
- Set Symbol Transparency to 56%.
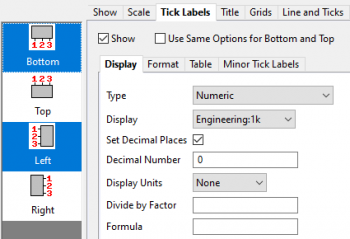
- Double-click on the Y axis to open the Axis dialog. Change the axis properties as follows:
- Activate the Tick Labels tab. Press the Ctrl key on the keyboard and click Bottom and Left in the left table to select both axes.
- In the Display sub-tab, select Engineering:1k for Display.
- Check the Set Decimal Places check box and set Decimal Number to 0. Press OK to close the dialog.
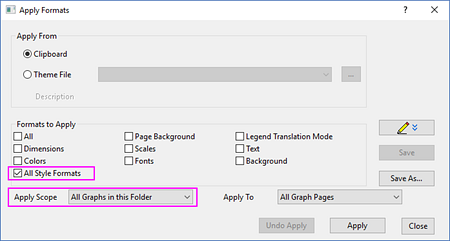
- Now we can copy the customized formats from this graph to the other three graphs. Right-click on a blank area of the graph such as outside the axes, and select Copy Format: All Style Formats from the context menu.
- Select Edit: Paste Format (Advanced)... from the main menu. In the Apply Formats dialog that opens, uncheck All under Formats to Apply group, and check All Style Formats checkbox. Change Apply Scope drop-down at the bottom to All Graphs in this Folder. Click the Apply button to paste the format to the other graph, and then click Close.
Merge and arrange graphs
- We will now merge these 4 graphs windows. Select Graph: Merge Graph Windows from the main menu.
- The Merge Graph Windows dialog opens. Accept the default settings and click OK. A new graph window with 4 layers is generated.
- Now we will re-arrange the 4 layers in the merged graph. Select Graph: Layer Management from the main menu. The Layer Management dialog will open.
- Activate the Arrange tab, then expand the Spacing (in % of Page Dimensions) branch. Set as follows:
- Horizontal Gap = 15
- Vertical Gap = 15
- Left Margin = 10
- Right Margin = 5
- Top Margin = 5
- Bottom Margin = 15
Click the Apply button.
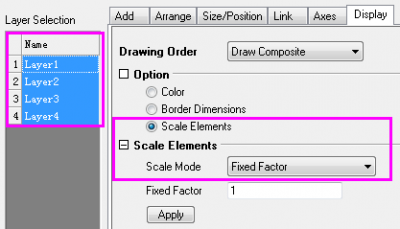
- Activate the Display tab. Press the Ctrl key on the keyboard and select all 4 layers in the Layer Selection table on the left. Then select the Scale Elements checkbox under the Option branch. Set Scale Mode to Fixed Factor and set the Fixed Factor to 1.
| By default, if you drag and resize a graph layer, or the layer gets resized when merging, text fonts and other graph objects get rescaled. Setting Scale Mode to Fixed Factor can prevent scaling of font size/line thickness when layer is resized. (This behavior can also be controlled in the Size tab of Plot Details dialog (layer level))
|
- Click the Apply button. Click OK to close the dialog.
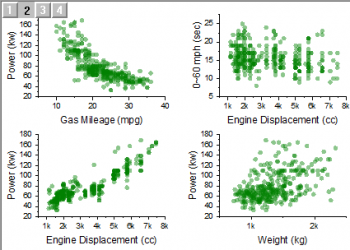
The merged graph should now appear as below:
- Activate the automobile workbook by double-clicking on the icon in the lower panel of Project Explorer. Select column B, click the Add or Remove Data Filter toolbar button
 to add a filter. to add a filter.
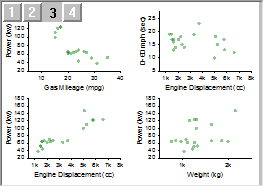
- Click on the filter icon at the top-left corner of the column header. In the context menu that appears, click Select All once to de-select all items, and then select the Honda checkbox and click OK, to only show rows where Make is Honda. All other rows will be hidden, and all graphs will update to reflect the change in the data.
Cloneable Template and Smart Plotting
- Let us now save the final merged graph as a template. Right click on its window title bar and select Save Template As. This will open the template_saveas dialog.
- Make sure Mark as Cloneable Template is selected and Match Plot Columns by is set to Long Name. Enter MyMergeGraph for Template Name and click OK. A message is dumped to the Message Log telling you the template is saved.
| Cloneable Templates save the column positions or column names along with all other graph properties. This allows for duplication of complex graph arrangements from other data with same arrangement of column positions or names.
|
- Activate the automobile workbook. Select the filter on column B and select both Honda and Lexus and click OK to show both makes.
- With the book still active, select Plot > User Templates: MyMergeGraph from the main menu. A new graph is created, with the same data assignments and formats as present in the previous merged graph.
Save your project file.
|