26.5.1 Workspace, text editor and other windowsWorkspace-TextEditor-And-OtherWindows
The window region in Code Builder is the main working environment where you can organize and develop your Origin C programs.
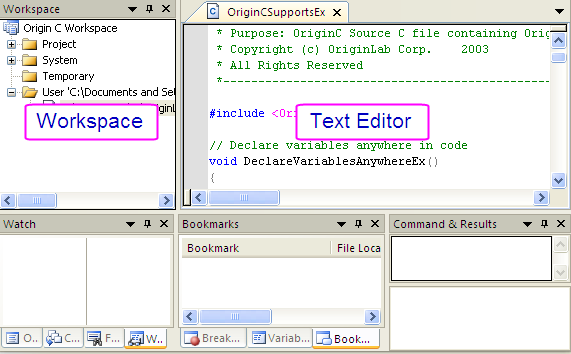
Text Editor is the primary editing tool in Code Builder. Other than Text Editor window, there are 9 other windows that you can utilize to efficiently develop your programs. You can organize the layout of those 9 windows by the following methods:
- Show or hide the windows as needed.
- The window can be opened or hidden through the View menu on the Menu bar. You can hide it by clicking the triangle button at the up-right end of the window and selecting Hide or simply pressing the × button at the up-right end of the window.
- Dock the windows side by side or stacked.
- Code Builder also allows you to drag-and-drop the window onto the navigation Arrow icon to dock the window anywhere you like. When docking the window to the same area, the windows will be stacked together like tabbed group.
- Set the windows as Floating.
- To make the window floating you can click the triangle button at the up-right end of the window and select Floating. If the window is not stacked with another window, you can drag it away from its docking area to make it floating.
- Auto-hide the windows.
- You can auto-hide the windows to obtain bigger editing space for Text Editor. Auto-hide the window will only display a tab with the window’s name on it. To auto-hide a window, you can click the triangle button at the up-right end of the window and select Auto Hide or simply press the pin button beside the × button.
Text Editor
Code Builder provides a text editor window for viewing, editing, and printing source, header, LabTalk script, and text files. When you open a file in Code Builder, the file opens in a new text editor window in the Multiple Document Interface (MDI) region of Code Builder.
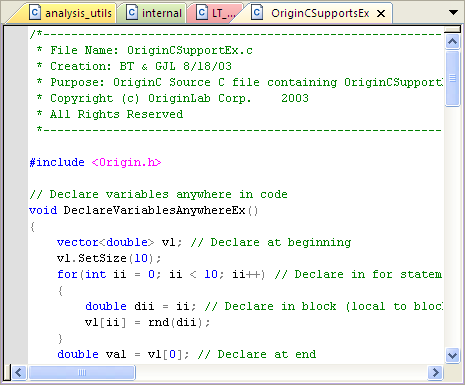
You can drag-and-drop the tab of a text editor window to the editing region, and it will be arranged side by side with other windows. And you can always drag it back to stack them together.
The Text Editor window supports standard keyboard and mouse text selection and cursor control. You can also perform the following editing operations:
- Cut, copy, paste, and delete text.
- Undo and redo your editing actions.
- Drag (copy) selected text between the Text Editor windows.
- Drag (move) selected text within a Text Editor window.
- Press F1 to bring up the related Help window when the cursor is on a function.
To customize the appearance or font style for your Text Editor, see The Options Dialog.
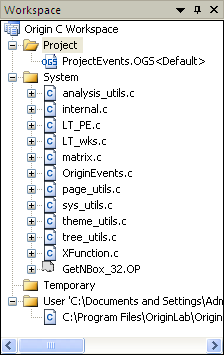
Workspace window
The Code Builder workspace is the main organizational tool for developing your programs and it serves two primary functions:
- The workspace folder structure organizes and facilitates easy access to your files.
- Only source files added to the workspace can be compiled and linked.
To better understand these aspects of the Code Builder workspace, see Tutorial:The Code Builder Workspace.
Also, you can create different workspaces for each of your programs, or develop all your programs in the same workspace. Like an Origin project file, only one workspace can be open in Code Builder at a time.
Other Windows
There are 8 other useful windows in Code Builder that are used to help you debugging your Origin C programs or LabTalk Scripts.
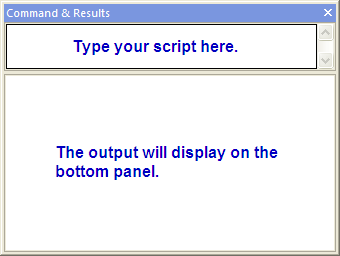
LabTalk Console
LabTalk console is a Code Builder window which is mainly used to execute LabTalk scripts. Most often, you will use LabTalk console to call your Origin C functions during the development process. To do this, type the LabTalk function call in the upper panel of the console. After pressing ENTER, the script is sent to the LabTalk interpreter and is executed. The output displays in the lower panel of the console.
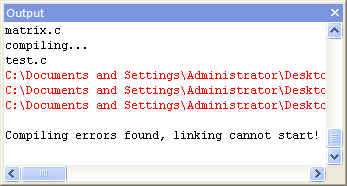
Output
Messages such as building results or error messages are output to the Output window. If an error message displays in the Output window, you can double-click on the message to go to the corresponding line of the source file in the Text Editor window.
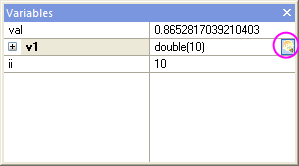
Watch and Local Variables
These two windows are used to monitor variable values.
The Local Variables window automatically displays all the variables for the current scope. As you step through the program in debug mode, the variable values update. Arrays, objects, and structures can be expanded in the window by clicking on the [+] box. You can click the magnifier button after the value of selected variable to bring up the Text Visualizer dialog to have a better view of the value.
The Watch window allows you to specify which variables you want to watch in debugging mode. You can add variables to or delete variables from the window while in debugging mode. You can also delete variables from it when you are not debugging a program.
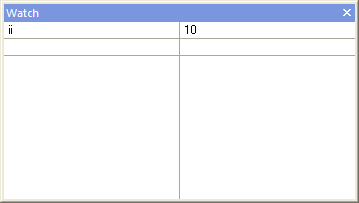
| Note: The Variables window only displays the values of variables having local scope, and consequently it does not display the values of LabTalk variables since they have global scope. However, the Watch window displays the values of variables having any scope, therefore it can show the values of LabTalk variables.
|
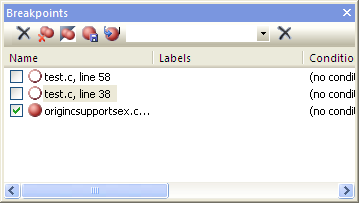
Breakpoints
This window is used to display all the breakpoints you set in all the files in the current Workspace. You can disable the breakpoints by un-checking the boxes before them. Double click on the breakpoint will bring the cursor to the line where the breakpoint is set.
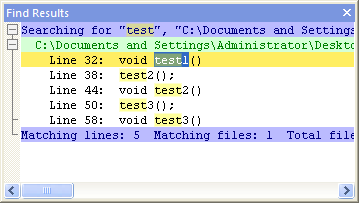
Find Results
When using the Find in Files dialog to find files that contain a specified character string, the result will output to the Find Results window. Double click on the result will bring the cursor to the line where the specified character string locates.
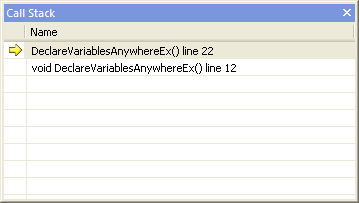
Call Stack
If the function that you are calling to start your program contains calls to other functions, you can use the Call Stack window to see the name of the function (and source code line number) that is currently executing as well as the functions that have already been called but have not yet returned control to the calling function. When a function is called, it is added to the top of the Call Stack window. When a function returns control to the calling function, it is removed from the Call Stack window.
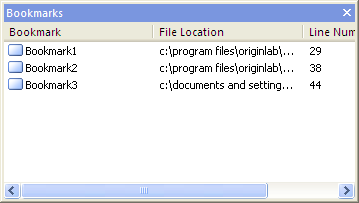
Bookmarks
Bookmarks allow you to flag lines of code so that you can easily return to the line later. All bookmarks set in all the files in the current Workspace are displayed in the Bookmarks window. Double click on the bookmark in the Bookmarks window will bring the cursor to the line where the bookmark is set.
|