29.1.3 Vertical Step GraphVerticalStep-Graph
Data Requirements
Select one or more Y columns or a range of data from at least one Y column. If there is an associated X column, X column supplies X values; otherwise, sampling interval of the Y column or row number is used.
Creating the Graph
Select required data.
From the menu, select .
or
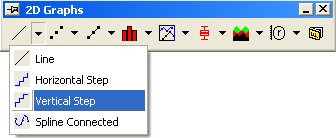
Click the Vertical Step button on the 2D Graphs toolbar.
Template
LINE.OTP (installed to the Origin program folder).
Notes
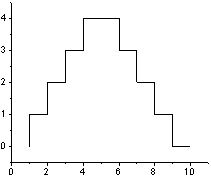
Each data point in the data plot is connected by a line. The line connection type is set to a step vertical connection (Step Vert) on the Line tab of the Plot Details dialog box (). The step vertical connection creates a right angle connection between data points, with an initial vertical line. The data points are not displayed.
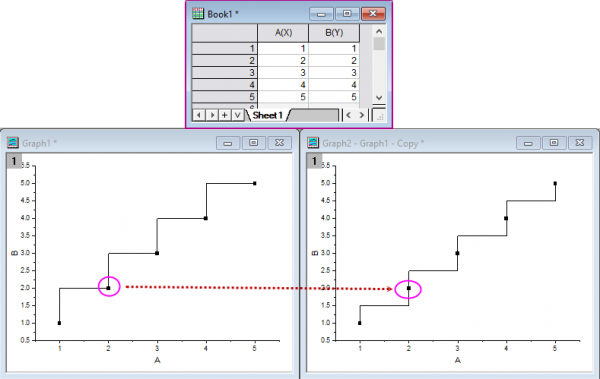
If you want the data point has been drawn at the center of vertical run, you can go to the Line tab of the Line tab of Plot Details dialog box to change Connect to Step V Center.
Binary Column to Plot a Step Graph
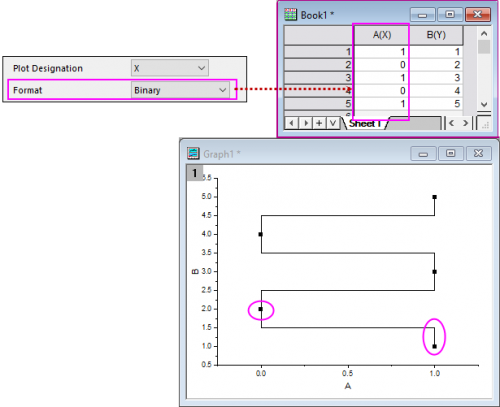
When the source column stores binary values("0"/"1", "Yes"/"No", or "True"/"False"), you can set its format to Binary, and then plot them as Line graph to show the binary status.
The line connection will be limited to step center connection only: When Y column is Binary, we draw as Step H Center; When X column is Binary, we draw as Step V Center.
|