4.3.5 IIR FilterIIR-Filter
Summary
In OriginPro, it is possible to design, analyze, and implement IIR (Infinite Impulse Response) digital filters. The IIR filter supports four methods, including Butterworth, Chebyshev Type I, Chebyshev Type II, and Elliptic.
This provides users more choices in signal processing.
Minimum Origin Version Required: 9.0 SR0
What You Will Learn
This tutorial will show you:
- How to design and apply an IIR filter
- A comparison between IIR filter and FFT filter
Steps
Design and Apply IIR Filter
- Start with a new worksheet and import the EMG Recording.dat file from \Samples\Signal Processing\.
- Highlight column B and Select Analysis:Signal Processing:IIR Filter from the top menu to open the dialog.
- Change the Response type as High Pass, keep the Method as Butterworth, uncheck the Minimum for Filter Order and set it as 4. In the Frequency Specification branch, set the Cutoff Frequency(Fc) as 20, then check the Forward-Backward Filtering. The dialog settings should look like the following figure, and the IIR filter is designed.
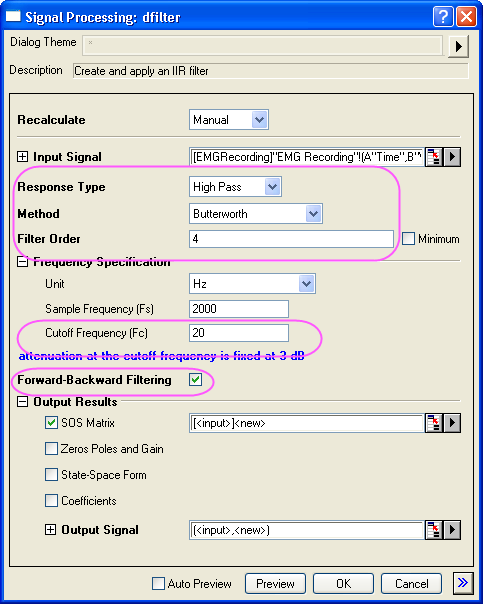
- Click OK to apply the created IIR filter to the input dataset.
- A new column will be added to the original data as a new column of filtered data and a new SOS Matrix worksheet.
Compare Results with FFT Filter
- Highlight column B in the original worksheet, perform FFT filter by Analysis:Signal Processing:FFT Filters.
- In the opened dialog, choose High Pass for Filter Type and set 20 as Cutoff Frequency.
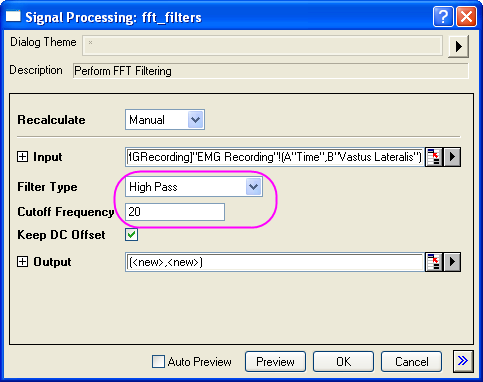
- Click OK button. Column C in the EMGRecording worksheet is the filtered result of the previously designed IIR filter, highlight column B and column C to generate a line plot with the
 button (Graph 1). button (Graph 1).
- Use the scale in button
 to zoom the area between 12.5s and 13.3s. to zoom the area between 12.5s and 13.3s.
- Column E in the EMGRecording worksheet is the filtered result of the FFT filter, highlight column B and column E to generate a line plot with the button (Graph 2).
- Also use the scale in button to zoom the area between 12.5s and 13.3s, the two graphs could be used for visualized comparison.
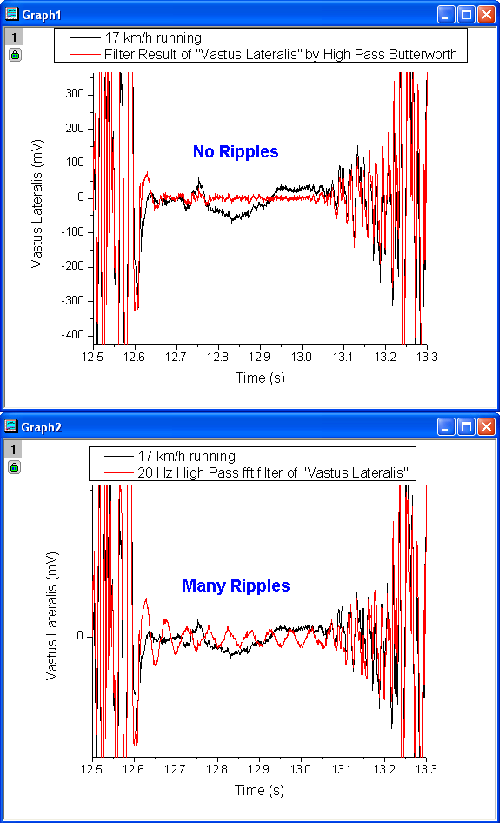
- Note that there are many ripples in the FFT filter result, but almost no ripples in the IIR filter result.
Ripples in FFT Filter
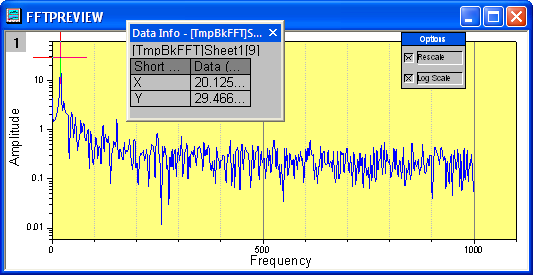
- Highlight column E and click on the button to create a line plot (Graph 3).
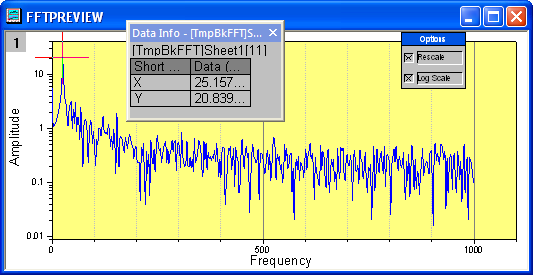
- Activate Graph 3, choose Gadget:FFT and set the X Scale as From 12.664 To 13.052.
- Click OK to bring up the preview window, in which ripples are almost pure 20.125 Hz sine.
- Now we will try to remove the ripples at 20.125 Hz by applying another high pass filter at 25 Hz, keep column E highlighted and select Analysis:Signal Processing:FFT Filters.
- Select High Pass for Filter Type and set Cutoff Frequency as 25.
- The result is listed in Column G, highlight column G and click on the button to create a line plot(Graph 4).
- Activate Graph 4, choose Gadget:FFT and set the X Scale as From 12.664 To 13.052, in the preview window, there are still ripples, and they are shifted from 20.125 Hz to 25.157 Hz.
- Note that the ripples could not be removed by FFT filter for this dataset.
|